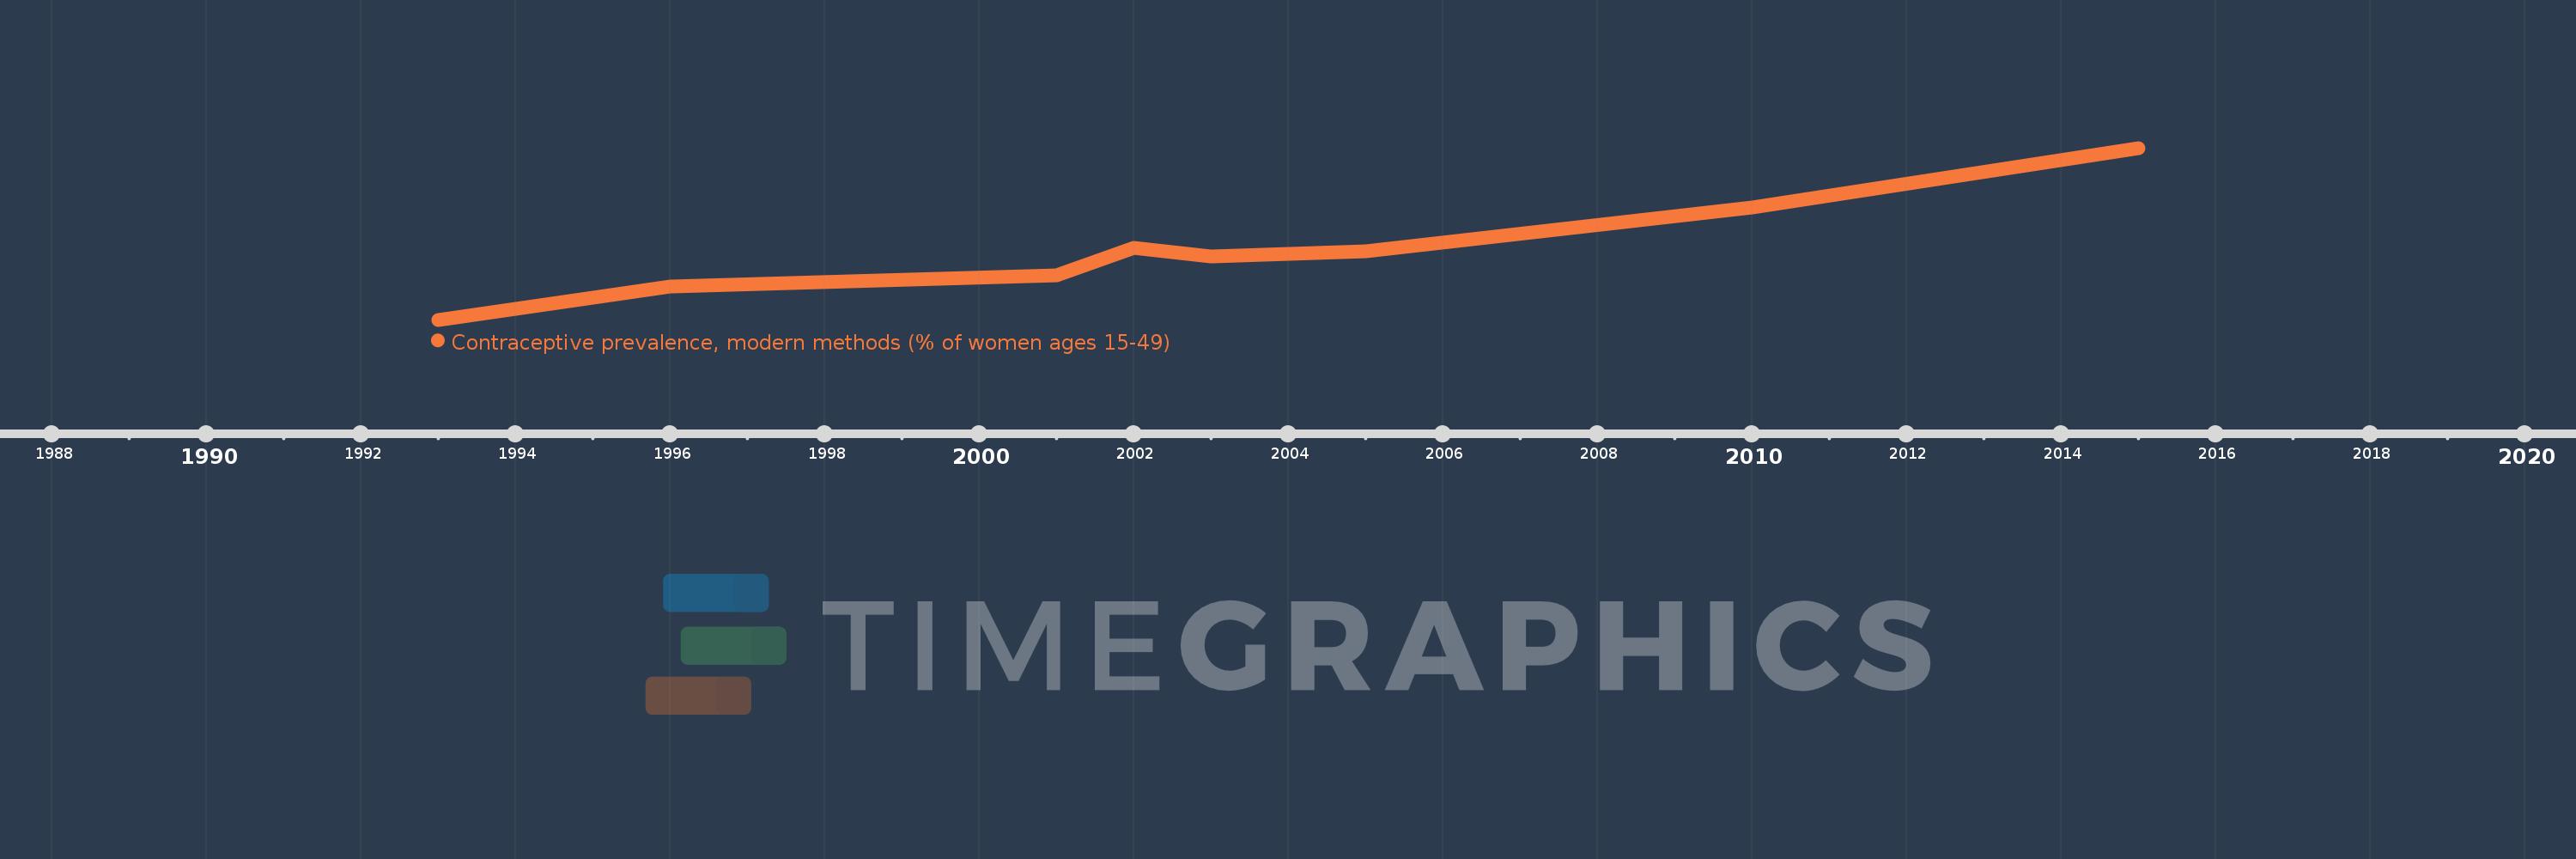
This timeline shows a graph from 1993 to 2015 of Lesotho. No data until 1992. Number of actual observations by date: 8.
Source name:
World Development Indicators
Source organization:
Household surveys, including Demographic and Health Surveys and Multiple Indicator Cluster Surveys. Largely compiled by United Nations Population Division.
Categories, topics:
Health
Last updated:
apr 23, 2017
Indicators value changes by year
Meaning:
35.712
Minimum:
18.9
jan 1, 1993
Maximum:
59.8
jan 1, 2015
At the date of observation
Value
Absolute change
Change from the previous value
jan 1, 1993
18.9
+18.9
0.0%
jan 1, 1996
26.8
+7.9
41.8%
jan 1, 2001
29.4
+2.6
9.7%
jan 1, 2002
36.1
+6.7
22.79%
jan 1, 2003
33.9
-2.2
-6.09%
jan 1, 2005
35.2
+1.3
3.83%
jan 1, 2010
45.6
+10.4
29.55%
jan 1, 2015
59.8
+14.2
31.14%
Ranking of countries by current statistics by years