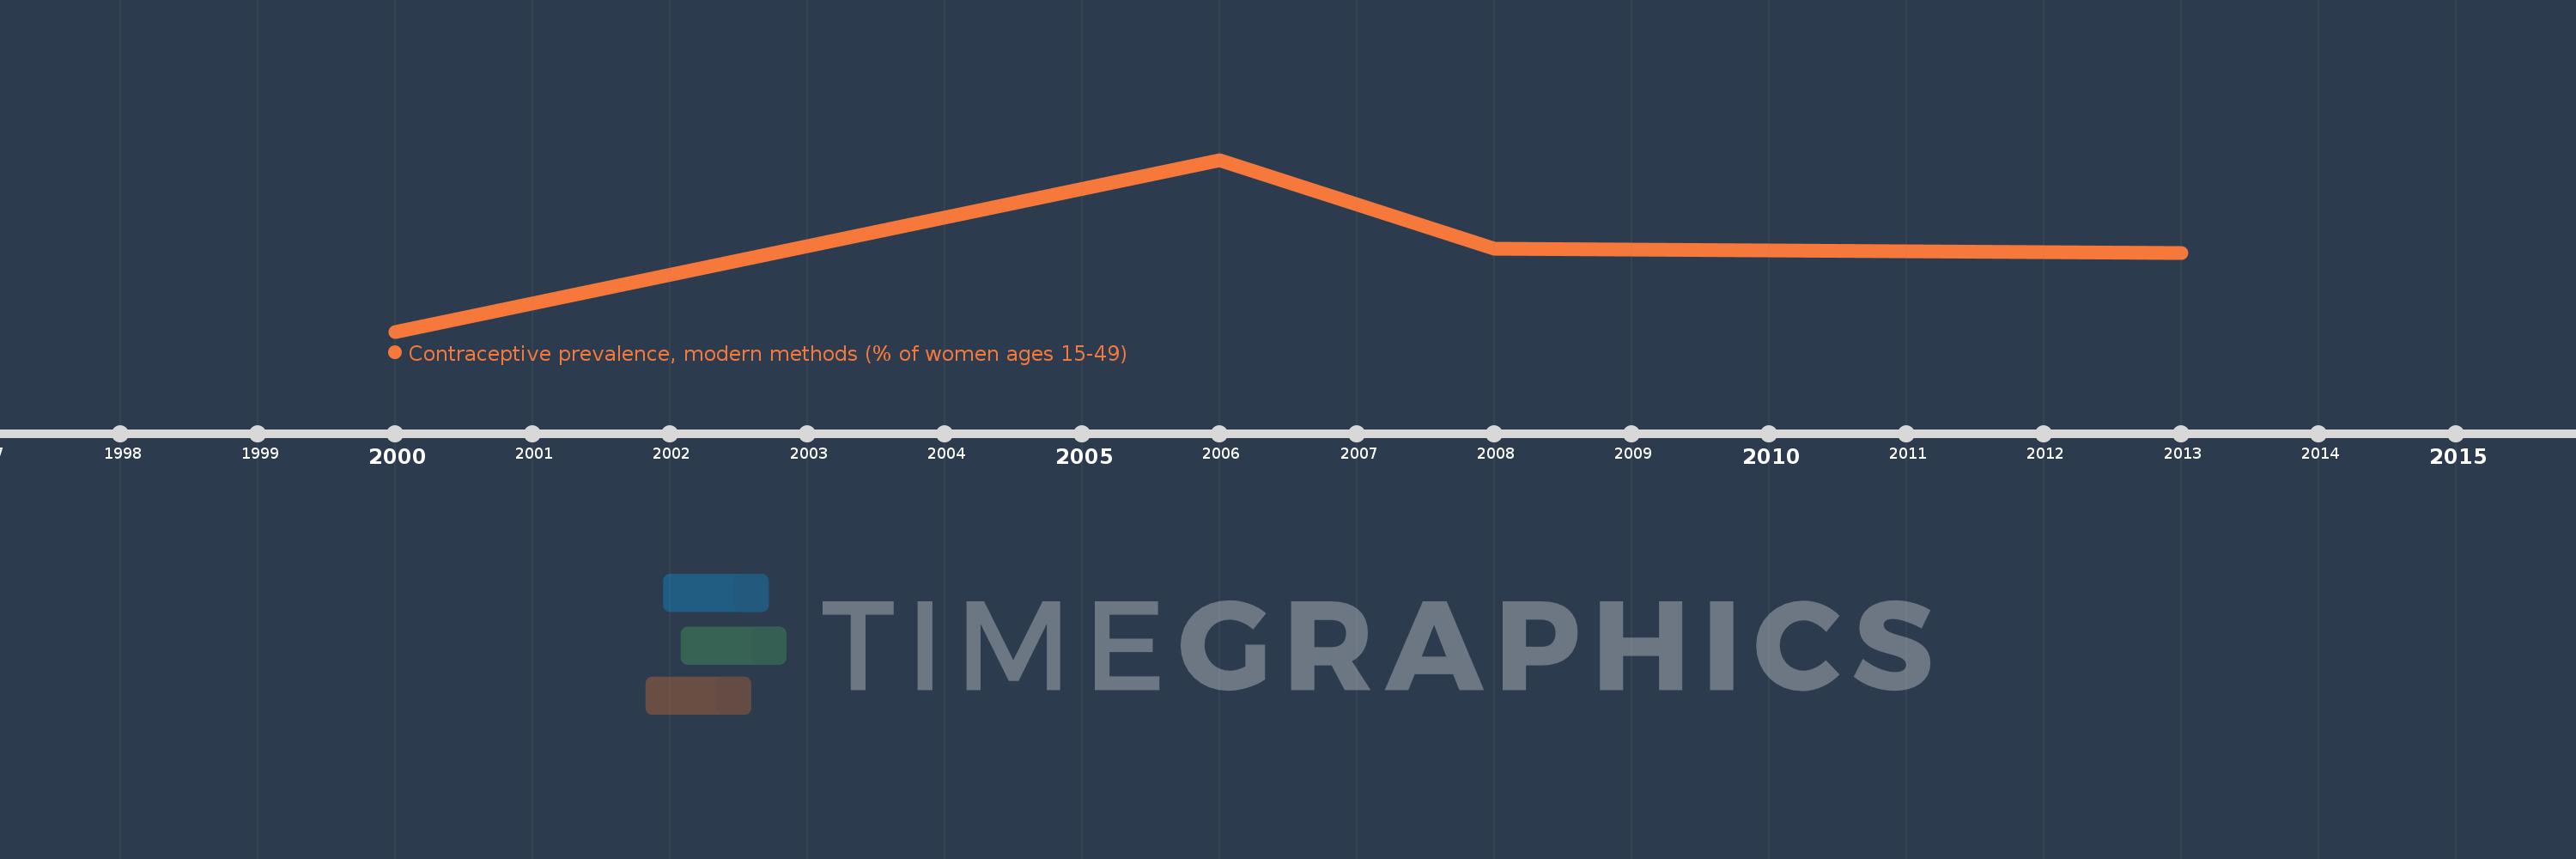
This timeline shows a graph from 2000 to 2013 of Ukraine. No data until 1999. Number of actual observations by date: 4.
Source name:
World Development Indicators
Source organization:
Household surveys, including Demographic and Health Surveys and Multiple Indicator Cluster Surveys. Largely compiled by United Nations Population Division.
Categories, topics:
Health
Last updated:
apr 23, 2017
Indicators value changes by year
Meaning:
47.575
Minimum:
37.6
jan 1, 2000
Maximum:
58.2
jan 1, 2006
At the date of observation
Value
Absolute change
Change from the previous value
jan 1, 2000
37.6
+37.6
0.0%
jan 1, 2006
58.2
+20.6
54.79%
jan 1, 2008
47.5
-10.7
-18.38%
jan 1, 2013
47.0
-0.5
-1.05%
Ranking of countries by current statistics by years