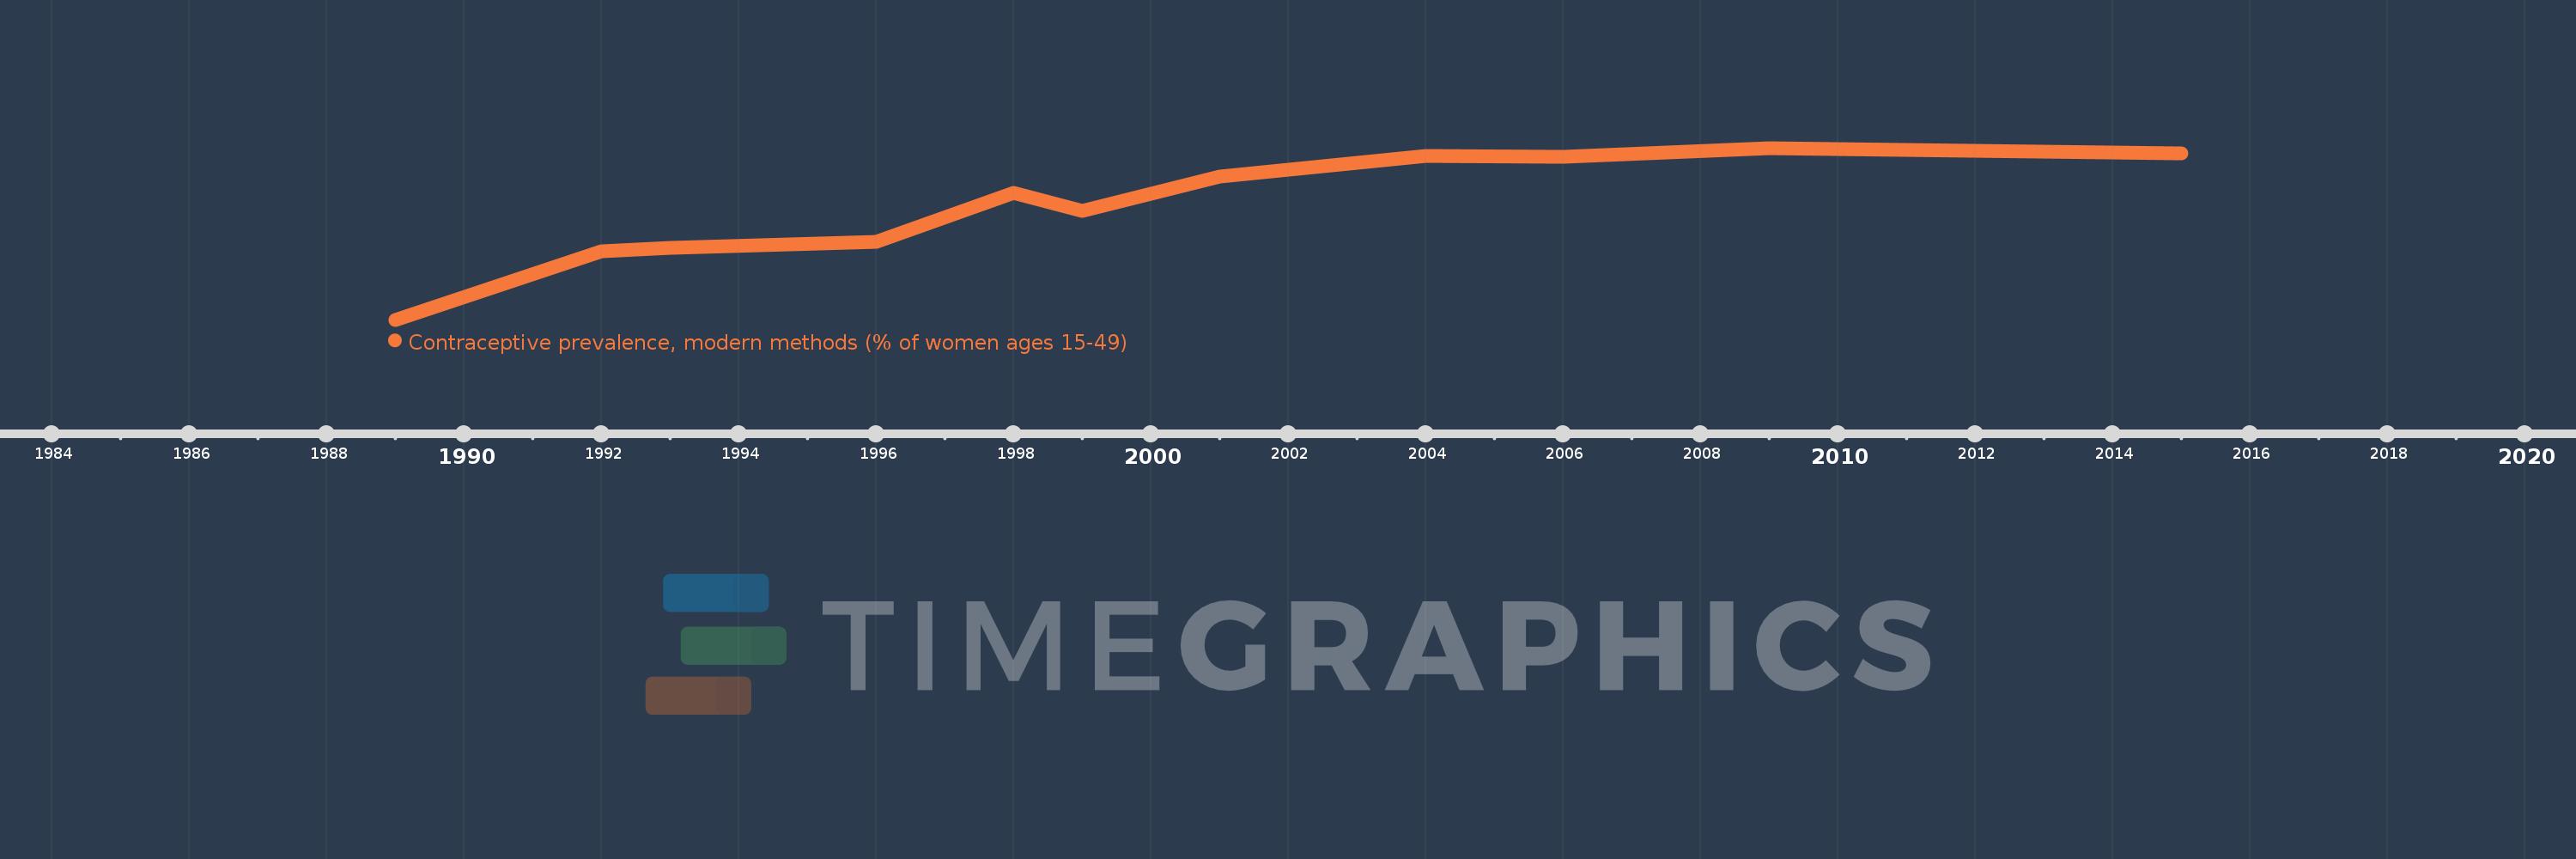
This timeline shows a graph from 1989 to 2015 of Egypt, Arab Rep.. No data until 1988. Number of actual observations by date: 11.
Source name:
World Development Indicators
Source organization:
Household surveys, including Demographic and Health Surveys and Multiple Indicator Cluster Surveys. Largely compiled by United Nations Population Division.
Categories, topics:
Health
Last updated:
apr 23, 2017
Indicators value changes by year
Meaning:
50.264
Minimum:
35.5
jan 1, 1989
Maximum:
57.6
jan 1, 2009
At the date of observation
Value
Absolute change
Change from the previous value
jan 1, 1989
35.5
+35.5
0.0%
jan 1, 1992
44.3
+8.8
24.79%
jan 1, 1993
44.8
+0.5
1.13%
jan 1, 1996
45.5
+0.7
1.56%
jan 1, 1998
51.8
+6.3
13.85%
jan 1, 1999
49.5
-2.3
-4.44%
jan 1, 2001
53.9
+4.4
8.89%
jan 1, 2004
56.6
+2.7
5.01%
jan 1, 2006
56.5
-0.1
-0.18%
jan 1, 2009
57.6
+1.1
1.95%
jan 1, 2015
56.9
-0.7
-1.22%
Ranking of countries by current statistics by years