33
/
AIzaSyB4mHJ5NPEv-XzF7P6NDYXjlkCWaeKw5bc
November 30, 2025
246096
South Africa
ZAF
true
2
1
PNG, bonds (NTR, current US$)
2016,2015,2014,2013,2012,2011,2010,2009,2008,2007,2006,2005,2004,2003,2002,2001,2000,1999,1998,1997,1996
Create a timeline
Public Timelines
For education
For educational institutions
For teachers
For students
Cabinet
For educational institutions
For teachers
For students
Open cabinet
FAQ
Close
Create a timeline
Public timelines
FAQ
About & Feedback
Terms
Privacy
FAQ
Support 24/7
Cabinet
Get premium
Donate
Download
Global statistics library
→
South Africa
→
PNG, bonds (NTR, current US$)
This statistics in other country:
Argentina
Armenia
Botswana
Brazil
Bulgaria
China
Colombia
Costa Rica
Dominican Republic
East Asia & Pacific (excluding high income)
Ecuador
Egypt, Arab Rep.
El Salvador
Europe & Central Asia (excluding high income)
Georgia
Ghana
Guatemala
IDA only
India
Indonesia
Jamaica
Kazakhstan
Lao PDR
Latin America & Caribbean (excluding high income)
Lebanon
Low & middle income
Lower middle income
Malaysia
Mexico
Middle East & North Africa (excluding high income)
Middle income
Mongolia
Nigeria
Pakistan
Panama
Paraguay
Peru
Philippines
Romania
Russian Federation
Serbia
South Africa
South Asia
Sri Lanka
Sub-Saharan Africa (excluding high income)
Thailand
Turkey
Ukraine
Upper middle income
Venezuela, RB
Vietnam
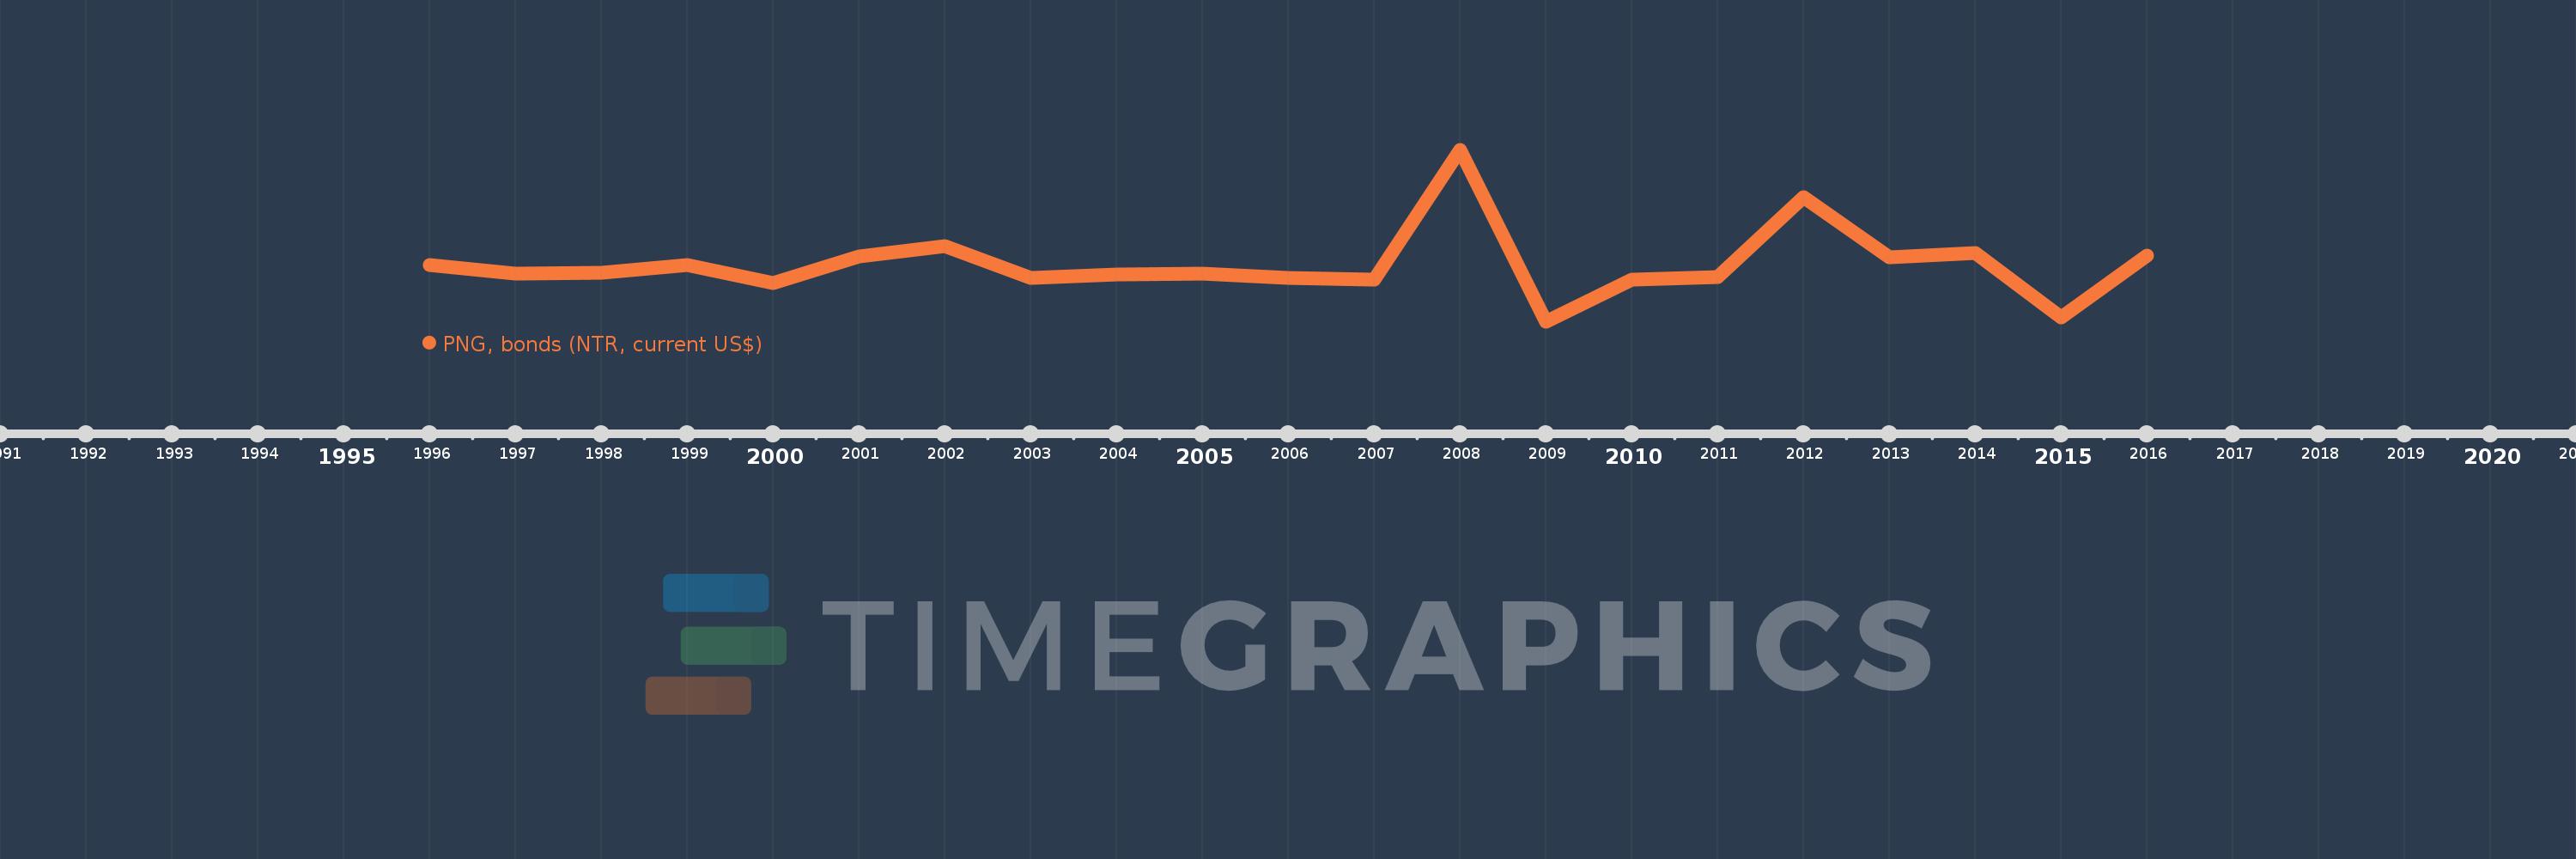
Timeline:
This timeline shows a graph from
1996
to
2016
of South Africa. No data until
1995
. Number of actual observations by date:
21
.
Source name:
World Development Indicators
Source organization:
World Bank, International Debt Statistics.
Categories, topics:
External Debt
Last updated:
apr 23, 2017
Indicators value changes by year
Meaning:
360.813 mln
Minimum:
-2.062 bln
jan 1, 2009
Maximum:
5.168 bln
jan 1, 2008
At the date of observation
Value
Absolute change
Change from the previous value
jan 1, 1996
350.0 mln
+350.0 mln
0.0%
jan 1, 1997
-24.5 mln
-374.5 mln
-107.0%
jan 1, 1998
19.707 mln
+44.207 mln
-180.44%
jan 1, 1999
345.899 mln
+326.192 mln
1.66K%
jan 1, 2000
-417.095 mln
-762.994 mln
-220.58%
jan 1, 2001
684.863 mln
+1.102 bln
-264.2%
jan 1, 2002
1.121 bln
+435.739 mln
63.62%
jan 1, 2003
-222.02 mln
-1.343 bln
-119.81%
jan 1, 2004
-54.584 mln
+167.436 mln
-75.41%
jan 1, 2005
-8.455 mln
+46.129 mln
-84.51%
jan 1, 2006
-211.641 mln
-203.186 mln
2.4K%
jan 1, 2007
-272.1 mln
-60.459 mln
28.57%
jan 1, 2008
5.168 bln
+5.441 bln
-2.0K%
jan 1, 2009
-2.062 bln
-7.23 bln
-139.89%
jan 1, 2010
-269.46 mln
+1.792 bln
-86.93%
jan 1, 2011
-158.709 mln
+110.751 mln
-41.1%
jan 1, 2012
3.188 bln
+3.347 bln
-2.11K%
jan 1, 2013
654.734 mln
-2.533 bln
-79.46%
jan 1, 2014
857.602 mln
+202.868 mln
30.98%
jan 1, 2015
-1.863 bln
-2.721 bln
-317.28%
jan 1, 2016
750.699 mln
+2.614 bln
-140.29%
Ranking of countries by current statistics by years
About & Feedback
Terms
Privacy
FAQ
Support 24/7
Cabinet
Get premium
Donate
The service accepts bank transfer (ACH, Wire) or cards (Visa, MasterCard, etc). Processed by Stripe.
Secured with SSL