33
/
AIzaSyB4mHJ5NPEv-XzF7P6NDYXjlkCWaeKw5bc
November 30, 2025
222693
Peru
PER
true
2
1
PNG, bonds (NTR, current US$)
2016,2015,2014,2013,2012,2011,2010,2009,2008,2007,2006,2005,2004,2003,2002,2001,2000,1998,1997,1996,1995
Create a timeline
Public Timelines
For education
For educational institutions
For teachers
For students
Cabinet
For educational institutions
For teachers
For students
Open cabinet
FAQ
Close
Create a timeline
Public timelines
FAQ
About & Feedback
Terms
Privacy
FAQ
Support 24/7
Cabinet
Get premium
Donate
Download
Global statistics library
→
Peru
→
PNG, bonds (NTR, current US$)
This statistics in other country:
Argentina
Armenia
Botswana
Brazil
Bulgaria
China
Colombia
Costa Rica
Dominican Republic
East Asia & Pacific (excluding high income)
Ecuador
Egypt, Arab Rep.
El Salvador
Europe & Central Asia (excluding high income)
Georgia
Ghana
Guatemala
IDA only
India
Indonesia
Jamaica
Kazakhstan
Lao PDR
Latin America & Caribbean (excluding high income)
Lebanon
Low & middle income
Lower middle income
Malaysia
Mexico
Middle East & North Africa (excluding high income)
Middle income
Mongolia
Nigeria
Pakistan
Panama
Paraguay
Peru
Philippines
Romania
Russian Federation
Serbia
South Africa
South Asia
Sri Lanka
Sub-Saharan Africa (excluding high income)
Thailand
Turkey
Ukraine
Upper middle income
Venezuela, RB
Vietnam
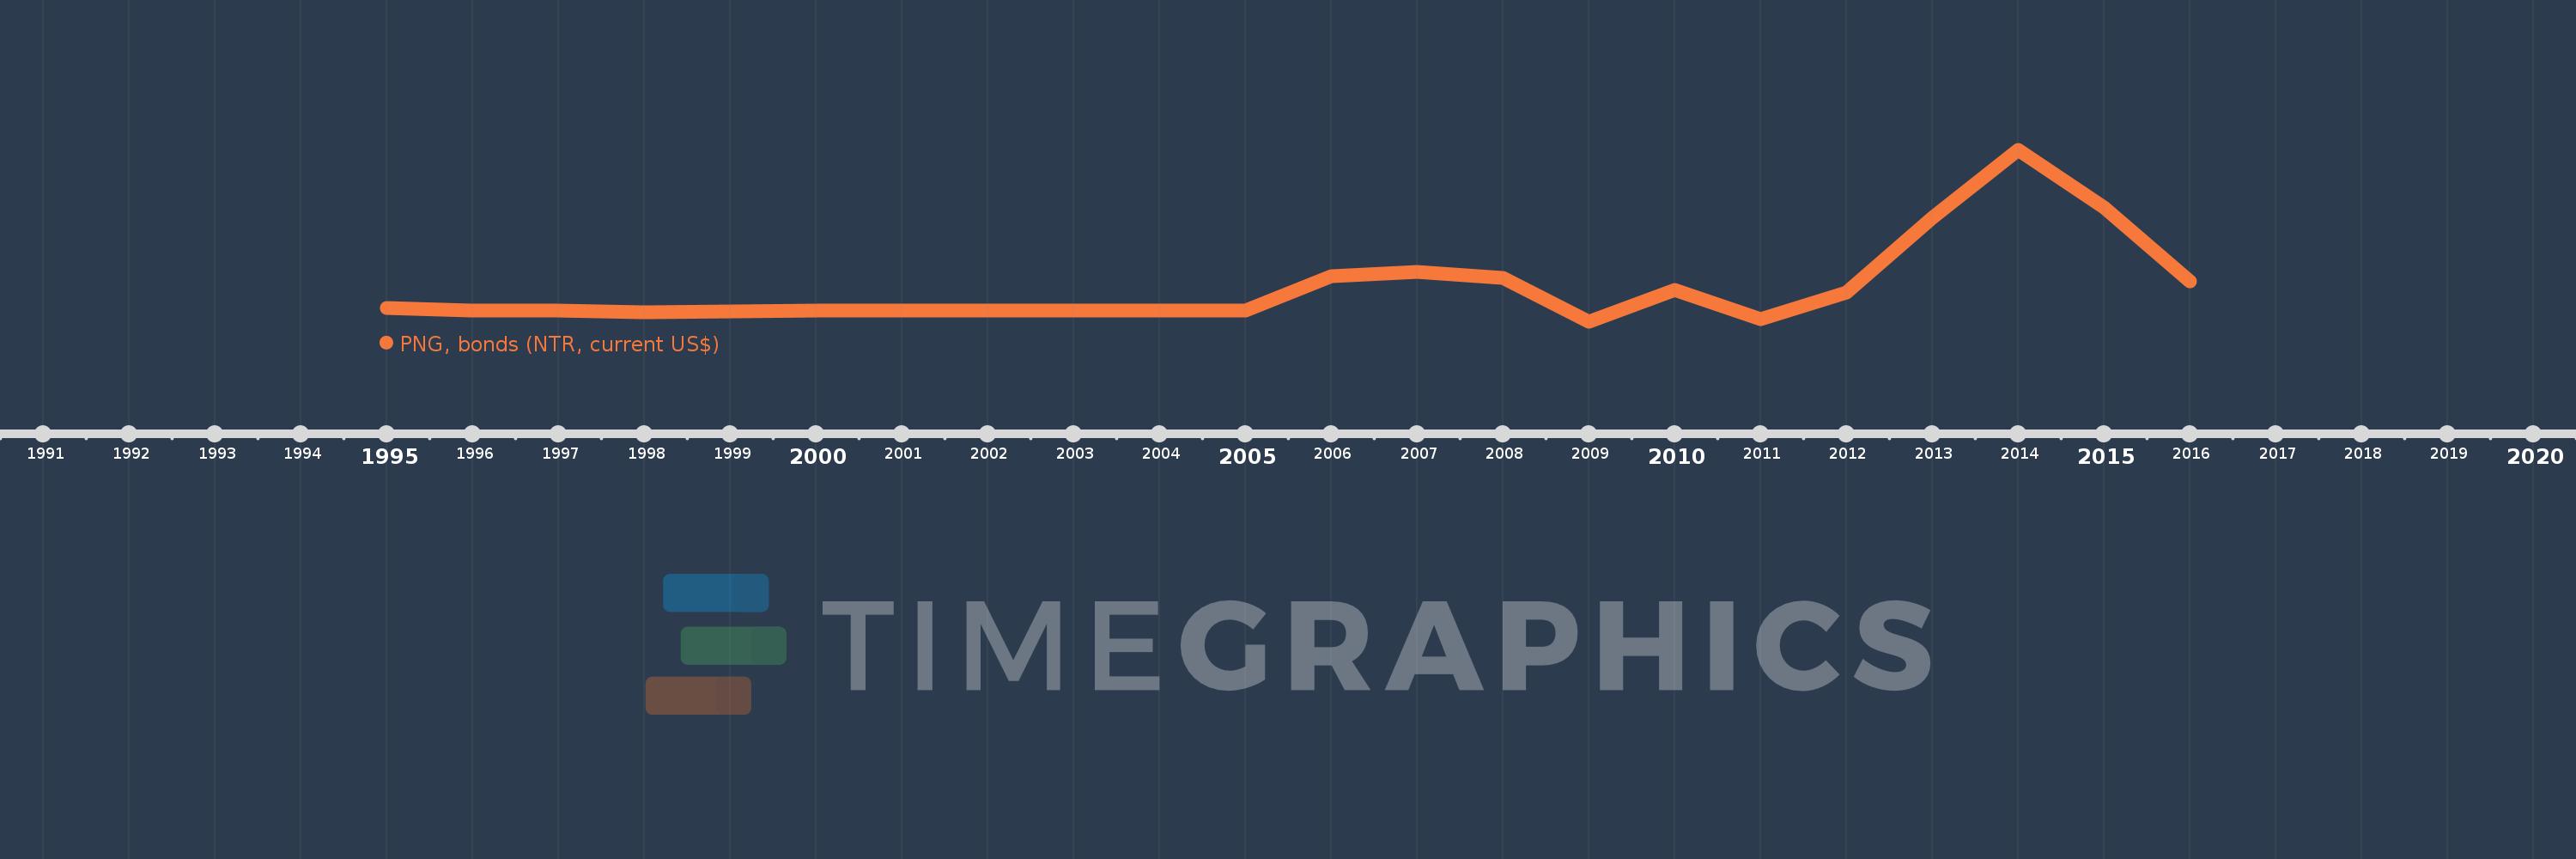
Timeline:
This timeline shows a graph from
1995
to
2016
of Peru. No data until
1994
. Number of actual observations by date:
21
.
Source name:
World Development Indicators
Source organization:
World Bank, International Debt Statistics.
Categories, topics:
External Debt
Last updated:
apr 23, 2017
Indicators value changes by year
Meaning:
720.441 mln
Minimum:
-362.983 mln
jan 1, 2009
Maximum:
4.828 bln
jan 1, 2014
At the date of observation
Value
Absolute change
Change from the previous value
jan 1, 1995
58.83 mln
+58.83 mln
0.0%
jan 1, 1996
-6.431 mln
-65.261 mln
-110.93%
jan 1, 1997
-6.224 mln
+207.0K
-3.22%
jan 1, 1998
-64.305 mln
-58.081 mln
933.18%
jan 1, 2000
-11.22 mln
+53.085 mln
-82.55%
jan 1, 2001
-11.22 mln
0.0
0.0%
jan 1, 2002
-11.22 mln
0.0
0.0%
jan 1, 2003
-9.731 mln
+1.489 mln
-13.27%
jan 1, 2004
-7.064 mln
+2.667 mln
-27.41%
jan 1, 2005
-6.779 mln
+285.0K
-4.03%
jan 1, 2006
1.024 bln
+1.03 bln
-15.2K%
jan 1, 2007
1.156 bln
+132.647 mln
12.96%
jan 1, 2008
977.411 mln
-178.752 mln
-15.46%
jan 1, 2009
-362.983 mln
-1.34 bln
-137.14%
jan 1, 2010
605.569 mln
+968.552 mln
-266.83%
jan 1, 2011
-283.7 mln
-889.269 mln
-146.85%
jan 1, 2012
515.123 mln
+798.823 mln
-281.57%
jan 1, 2013
2.784 bln
+2.268 bln
440.37%
jan 1, 2014
4.828 bln
+2.044 bln
73.45%
jan 1, 2015
3.097 bln
-1.731 bln
-35.86%
jan 1, 2016
865.087 mln
-2.232 bln
-72.07%
Ranking of countries by current statistics by years
About & Feedback
Terms
Privacy
FAQ
Support 24/7
Cabinet
Get premium
Donate
The service accepts bank transfer (ACH, Wire) or cards (Visa, MasterCard, etc). Processed by Stripe.
Secured with SSL