33
/
AIzaSyB4mHJ5NPEv-XzF7P6NDYXjlkCWaeKw5bc
November 30, 2025
155103
India
IND
true
2
1
PNG, bonds (NTR, current US$)
2016,2015,2014,2013,2012,2011,2010,2009,2008,2007,2006,2005,2004,2003,2002,2001,2000,1999,1998,1997,1996,1995,1994
Create a timeline
Public Timelines
For education
For educational institutions
For teachers
For students
Cabinet
For educational institutions
For teachers
For students
Open cabinet
FAQ
Close
Create a timeline
Public timelines
FAQ
About & Feedback
Terms
Privacy
FAQ
Support 24/7
Cabinet
Get premium
Donate
Download
Global statistics library
→
India
→
PNG, bonds (NTR, current US$)
This statistics in other country:
Argentina
Armenia
Botswana
Brazil
Bulgaria
China
Colombia
Costa Rica
Dominican Republic
East Asia & Pacific (excluding high income)
Ecuador
Egypt, Arab Rep.
El Salvador
Europe & Central Asia (excluding high income)
Georgia
Ghana
Guatemala
IDA only
India
Indonesia
Jamaica
Kazakhstan
Lao PDR
Latin America & Caribbean (excluding high income)
Lebanon
Low & middle income
Lower middle income
Malaysia
Mexico
Middle East & North Africa (excluding high income)
Middle income
Mongolia
Nigeria
Pakistan
Panama
Paraguay
Peru
Philippines
Romania
Russian Federation
Serbia
South Africa
South Asia
Sri Lanka
Sub-Saharan Africa (excluding high income)
Thailand
Turkey
Ukraine
Upper middle income
Venezuela, RB
Vietnam
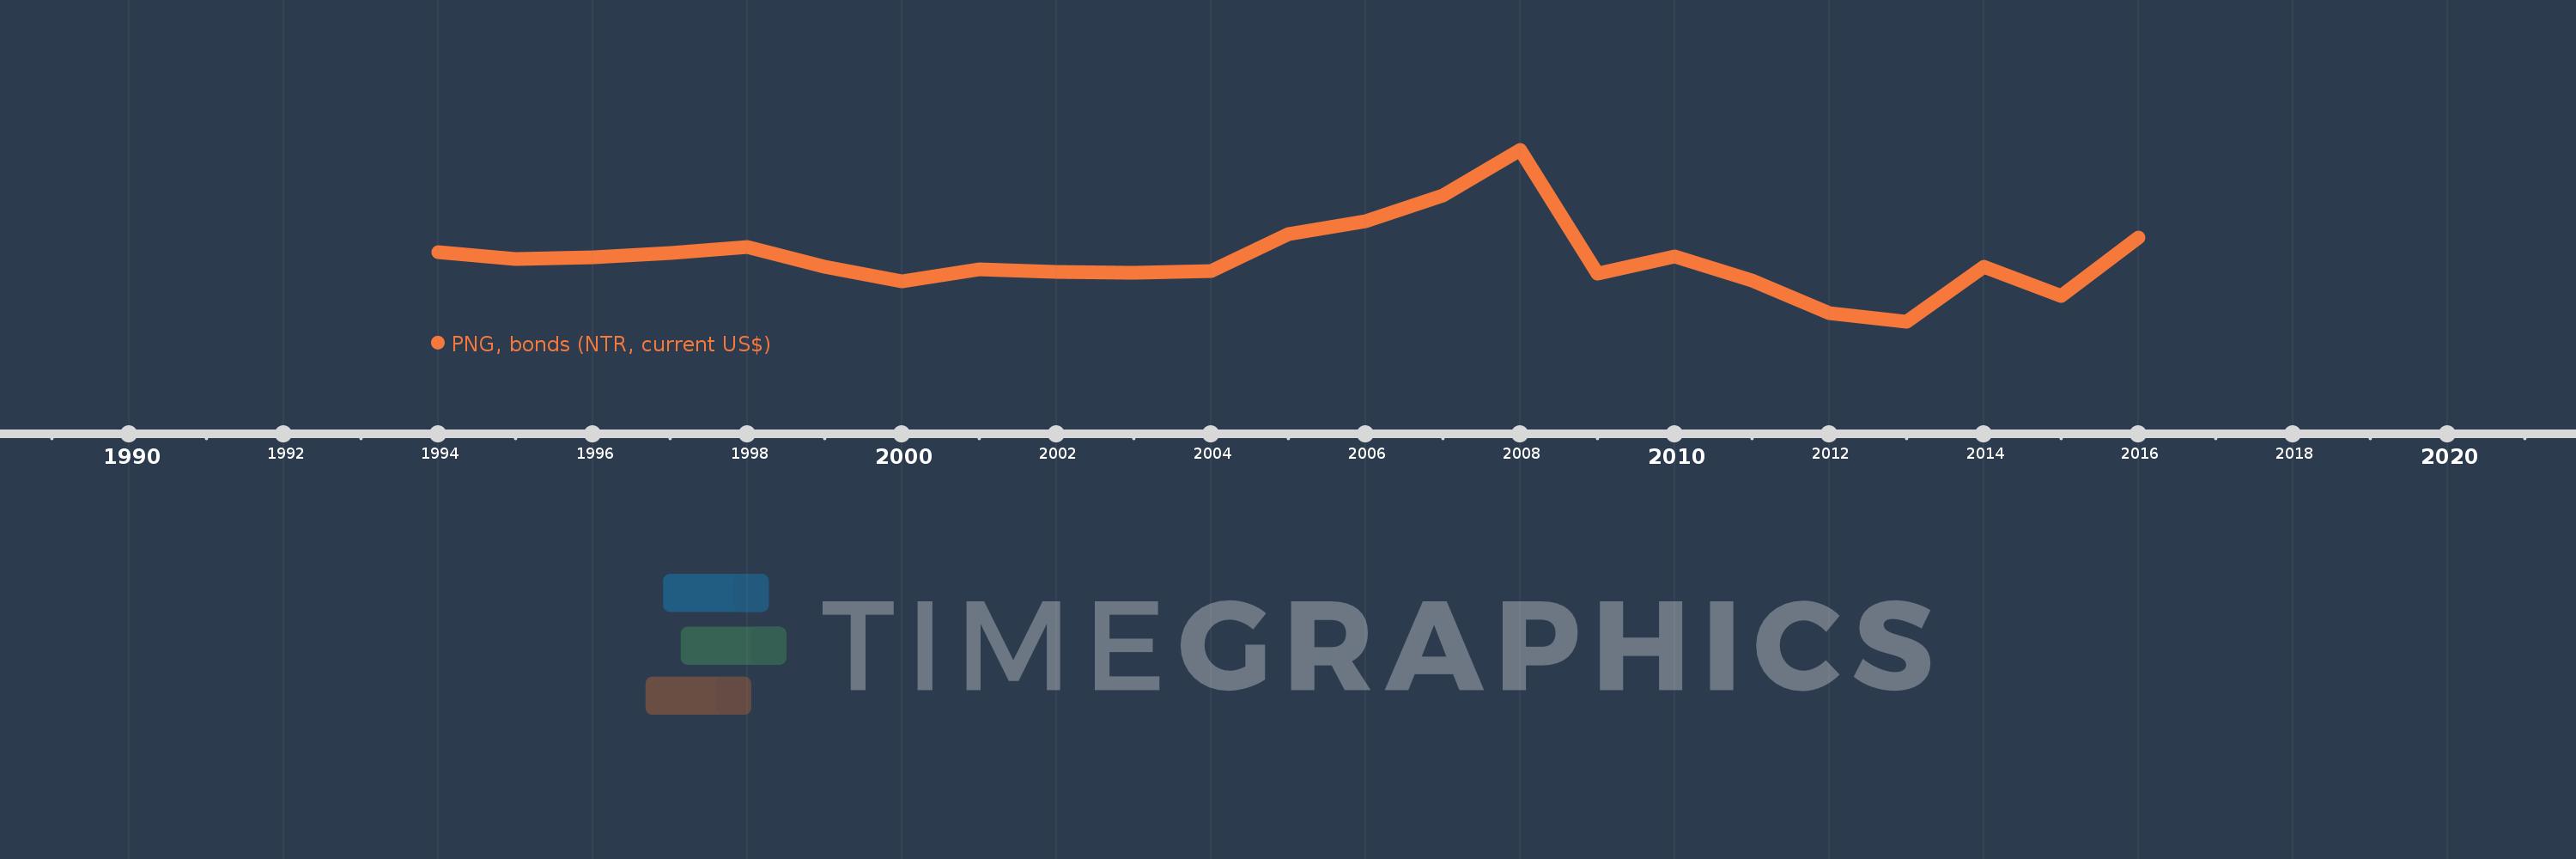
Timeline:
This timeline shows a graph from
1994
to
2016
of India. No data until
1993
. Number of actual observations by date:
23
.
Source name:
World Development Indicators
Source organization:
World Bank, International Debt Statistics.
Categories, topics:
External Debt
Last updated:
apr 23, 2017
Indicators value changes by year
Meaning:
373.048 mln
Minimum:
-3.529 bln
jan 1, 2013
Maximum:
7.054 bln
jan 1, 2008
At the date of observation
Value
Absolute change
Change from the previous value
jan 1, 1994
793.439 mln
+793.439 mln
0.0%
jan 1, 1995
347.205 mln
-446.234 mln
-56.24%
jan 1, 1996
463.874 mln
+116.669 mln
33.6%
jan 1, 1997
696.635 mln
+232.761 mln
50.18%
jan 1, 1998
1.067 bln
+370.508 mln
53.19%
jan 1, 1999
-114.365 mln
-1.182 bln
-110.72%
jan 1, 2000
-1.008 bln
-893.328 mln
781.12%
jan 1, 2001
-259.319 mln
+748.374 mln
-74.27%
jan 1, 2002
-459.314 mln
-199.995 mln
77.12%
jan 1, 2003
-517.44 mln
-58.126 mln
12.65%
jan 1, 2004
-409.652 mln
+107.788 mln
-20.83%
jan 1, 2005
1.895 bln
+2.305 bln
-562.65%
jan 1, 2006
2.662 bln
+766.488 mln
40.44%
jan 1, 2007
4.275 bln
+1.613 bln
60.61%
jan 1, 2008
7.054 bln
+2.779 bln
65.0%
jan 1, 2009
-564.05 mln
-7.618 bln
-108.0%
jan 1, 2010
504.827 mln
+1.069 bln
-189.5%
jan 1, 2011
-983.444 mln
-1.488 bln
-294.81%
jan 1, 2012
-2.958 bln
-1.975 bln
200.83%
jan 1, 2013
-3.529 bln
-570.848 mln
19.3%
jan 1, 2014
-126.915 mln
+3.402 bln
-96.4%
jan 1, 2015
-1.903 bln
-1.776 bln
1.4K%
jan 1, 2016
1.655 bln
+3.558 bln
-186.93%
Ranking of countries by current statistics by years
About & Feedback
Terms
Privacy
FAQ
Support 24/7
Cabinet
Get premium
Donate
The service accepts bank transfer (ACH, Wire) or cards (Visa, MasterCard, etc). Processed by Stripe.
Secured with SSL