33
/
AIzaSyB4mHJ5NPEv-XzF7P6NDYXjlkCWaeKw5bc
November 30, 2025
106429
China
CHN
true
2
1
PNG, bonds (NTR, current US$)
2016,2015,2014,2013,2012,2011,2010,2009,2008,2007,2006,2005,2004,2003,2002,2001,2000,1999,1998,1997,1996,1995,1994,1993
Create a timeline
Public Timelines
For education
For educational institutions
For teachers
For students
Cabinet
For educational institutions
For teachers
For students
Open cabinet
FAQ
Close
Create a timeline
Public timelines
FAQ
About & Feedback
Terms
Privacy
FAQ
Support 24/7
Cabinet
Get premium
Donate
Download
Global statistics library
→
China
→
PNG, bonds (NTR, current US$)
This statistics in other country:
Argentina
Armenia
Botswana
Brazil
Bulgaria
China
Colombia
Costa Rica
Dominican Republic
East Asia & Pacific (excluding high income)
Ecuador
Egypt, Arab Rep.
El Salvador
Europe & Central Asia (excluding high income)
Georgia
Ghana
Guatemala
IDA only
India
Indonesia
Jamaica
Kazakhstan
Lao PDR
Latin America & Caribbean (excluding high income)
Lebanon
Low & middle income
Lower middle income
Malaysia
Mexico
Middle East & North Africa (excluding high income)
Middle income
Mongolia
Nigeria
Pakistan
Panama
Paraguay
Peru
Philippines
Romania
Russian Federation
Serbia
South Africa
South Asia
Sri Lanka
Sub-Saharan Africa (excluding high income)
Thailand
Turkey
Ukraine
Upper middle income
Venezuela, RB
Vietnam
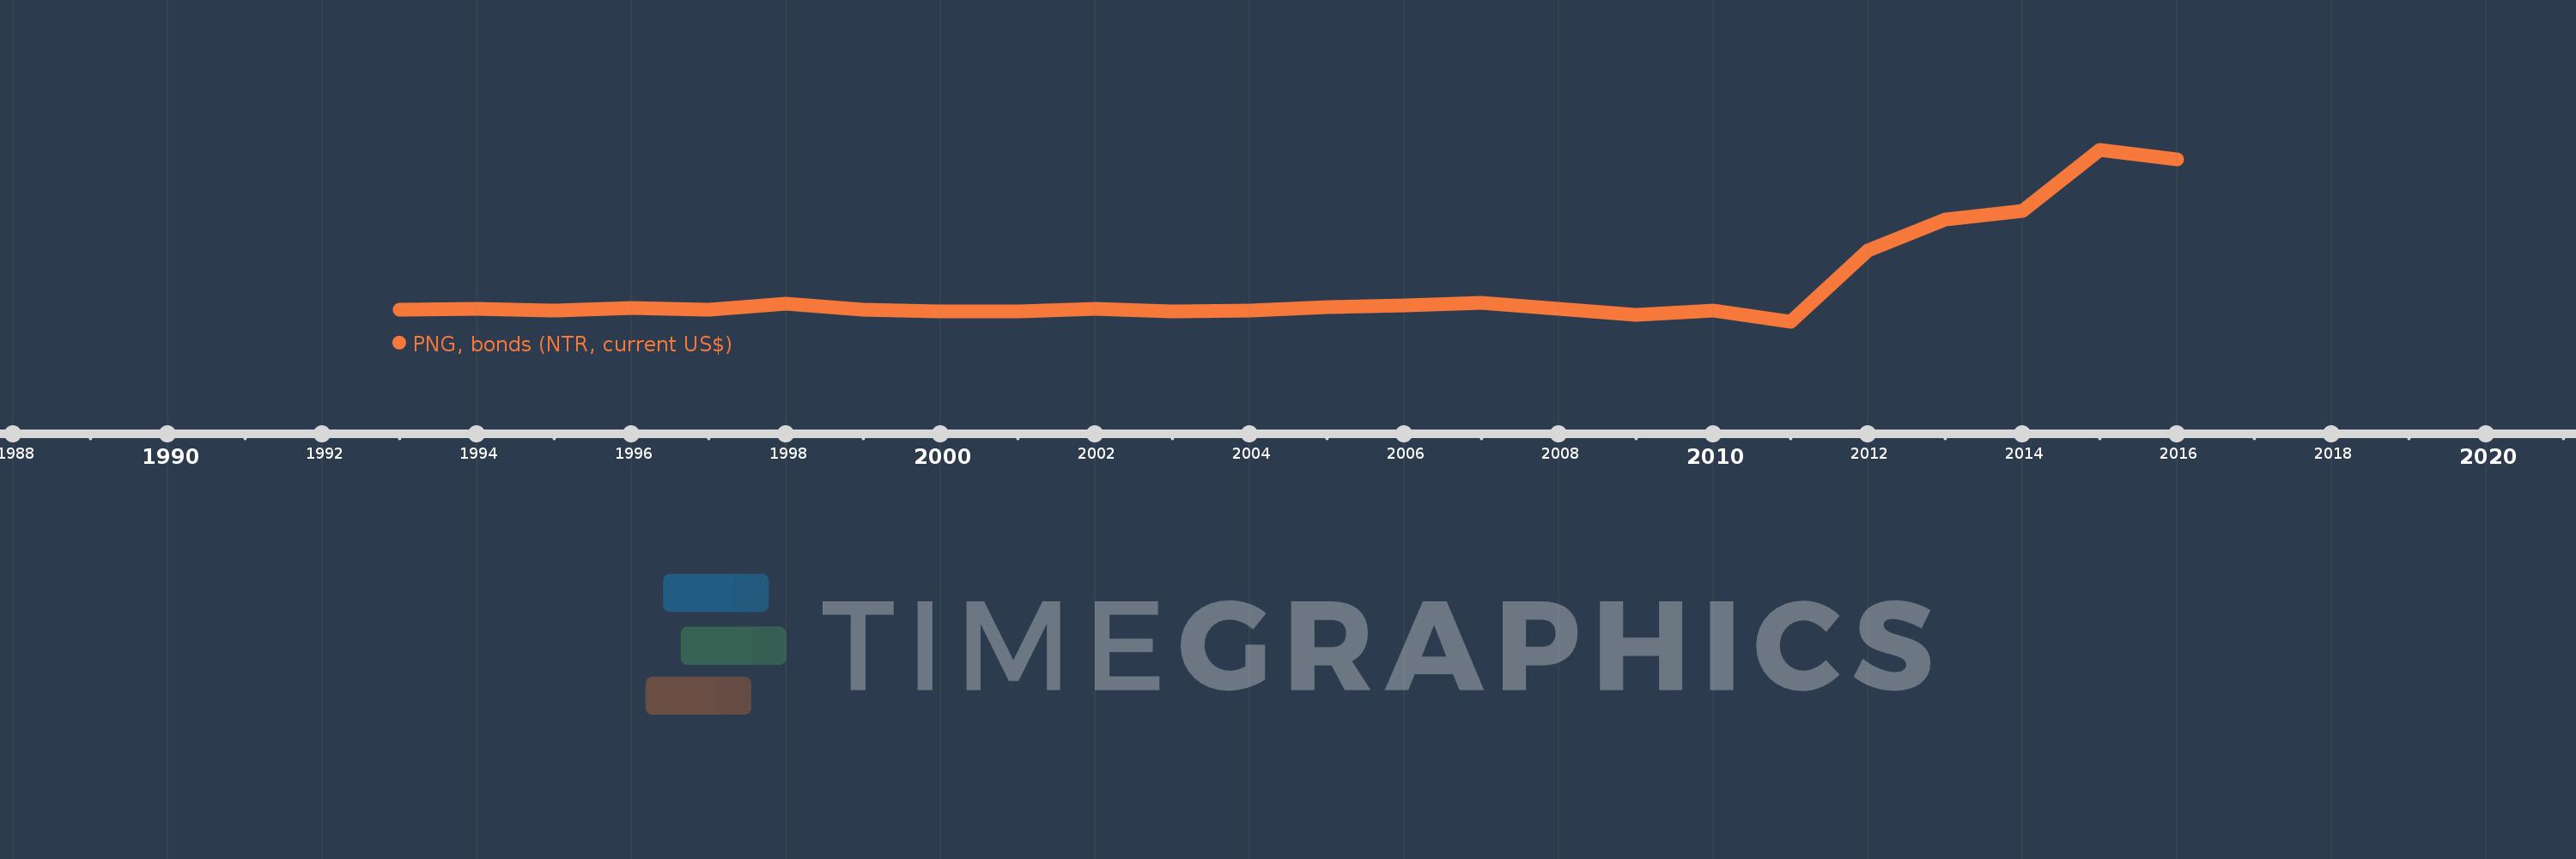
Timeline:
This timeline shows a graph from
1993
to
2016
of China. No data until
1992
. Number of actual observations by date:
24
.
Source name:
World Development Indicators
Source organization:
World Bank, International Debt Statistics.
Categories, topics:
External Debt
Last updated:
apr 23, 2017
Indicators value changes by year
Meaning:
4.458 bln
Minimum:
-2.132 bln
jan 1, 2011
Maximum:
29.687 bln
jan 1, 2015
At the date of observation
Value
Absolute change
Change from the previous value
jan 1, 1993
197.575 mln
+197.575 mln
0.0%
jan 1, 1994
320.281 mln
+122.706 mln
62.11%
jan 1, 1995
-26.213 mln
-346.494 mln
-108.18%
jan 1, 1996
510.642 mln
+536.855 mln
-2.05K%
jan 1, 1997
75.555 mln
-435.087 mln
-85.2%
jan 1, 1998
1.256 bln
+1.18 bln
1.56K%
jan 1, 1999
220.408 mln
-1.035 bln
-82.45%
jan 1, 2000
-95.662 mln
-316.07 mln
-143.4%
jan 1, 2001
-237.053 mln
-141.391 mln
147.8%
jan 1, 2002
365.088 mln
+602.141 mln
-254.01%
jan 1, 2003
-108.599 mln
-473.687 mln
-129.75%
jan 1, 2004
-58.424 mln
+50.175 mln
-46.2%
jan 1, 2005
588.867 mln
+647.291 mln
-1.11K%
jan 1, 2006
1.004 bln
+415.52 mln
70.56%
jan 1, 2007
1.362 bln
+358.067 mln
35.65%
jan 1, 2008
295.355 mln
-1.067 bln
-78.32%
jan 1, 2009
-781.401 mln
-1.077 bln
-364.56%
jan 1, 2010
16.22 mln
+797.621 mln
-102.08%
jan 1, 2011
-2.132 bln
-2.148 bln
-13.24K%
jan 1, 2012
11.163 bln
+13.295 bln
-623.67%
jan 1, 2013
16.835 bln
+5.672 bln
50.81%
jan 1, 2014
18.482 bln
+1.647 bln
9.78%
jan 1, 2015
29.687 bln
+11.205 bln
60.62%
jan 1, 2016
28.049 bln
-1.638 bln
-5.52%
Ranking of countries by current statistics by years
About & Feedback
Terms
Privacy
FAQ
Support 24/7
Cabinet
Get premium
Donate
The service accepts bank transfer (ACH, Wire) or cards (Visa, MasterCard, etc). Processed by Stripe.
Secured with SSL