33
/
AIzaSyB4mHJ5NPEv-XzF7P6NDYXjlkCWaeKw5bc
November 30, 2025
107760
Colombia
COL
true
2
1
PNG, bonds (NTR, current US$)
2016,2015,2014,2013,2012,2011,2010,2009,2008,2007,2006,2005,2004,2003,2002,2001,2000,1999,1998,1997,1996,1995
Create a timeline
Public Timelines
For education
For educational institutions
For teachers
For students
Cabinet
For educational institutions
For teachers
For students
Open cabinet
FAQ
Close
Create a timeline
Public timelines
FAQ
About & Feedback
Terms
Privacy
FAQ
Support 24/7
Cabinet
Get premium
Donate
Download
Global statistics library
→
Colombia
→
PNG, bonds (NTR, current US$)
This statistics in other country:
Argentina
Armenia
Botswana
Brazil
Bulgaria
China
Colombia
Costa Rica
Dominican Republic
East Asia & Pacific (excluding high income)
Ecuador
Egypt, Arab Rep.
El Salvador
Europe & Central Asia (excluding high income)
Georgia
Ghana
Guatemala
IDA only
India
Indonesia
Jamaica
Kazakhstan
Lao PDR
Latin America & Caribbean (excluding high income)
Lebanon
Low & middle income
Lower middle income
Malaysia
Mexico
Middle East & North Africa (excluding high income)
Middle income
Mongolia
Nigeria
Pakistan
Panama
Paraguay
Peru
Philippines
Romania
Russian Federation
Serbia
South Africa
South Asia
Sri Lanka
Sub-Saharan Africa (excluding high income)
Thailand
Turkey
Ukraine
Upper middle income
Venezuela, RB
Vietnam
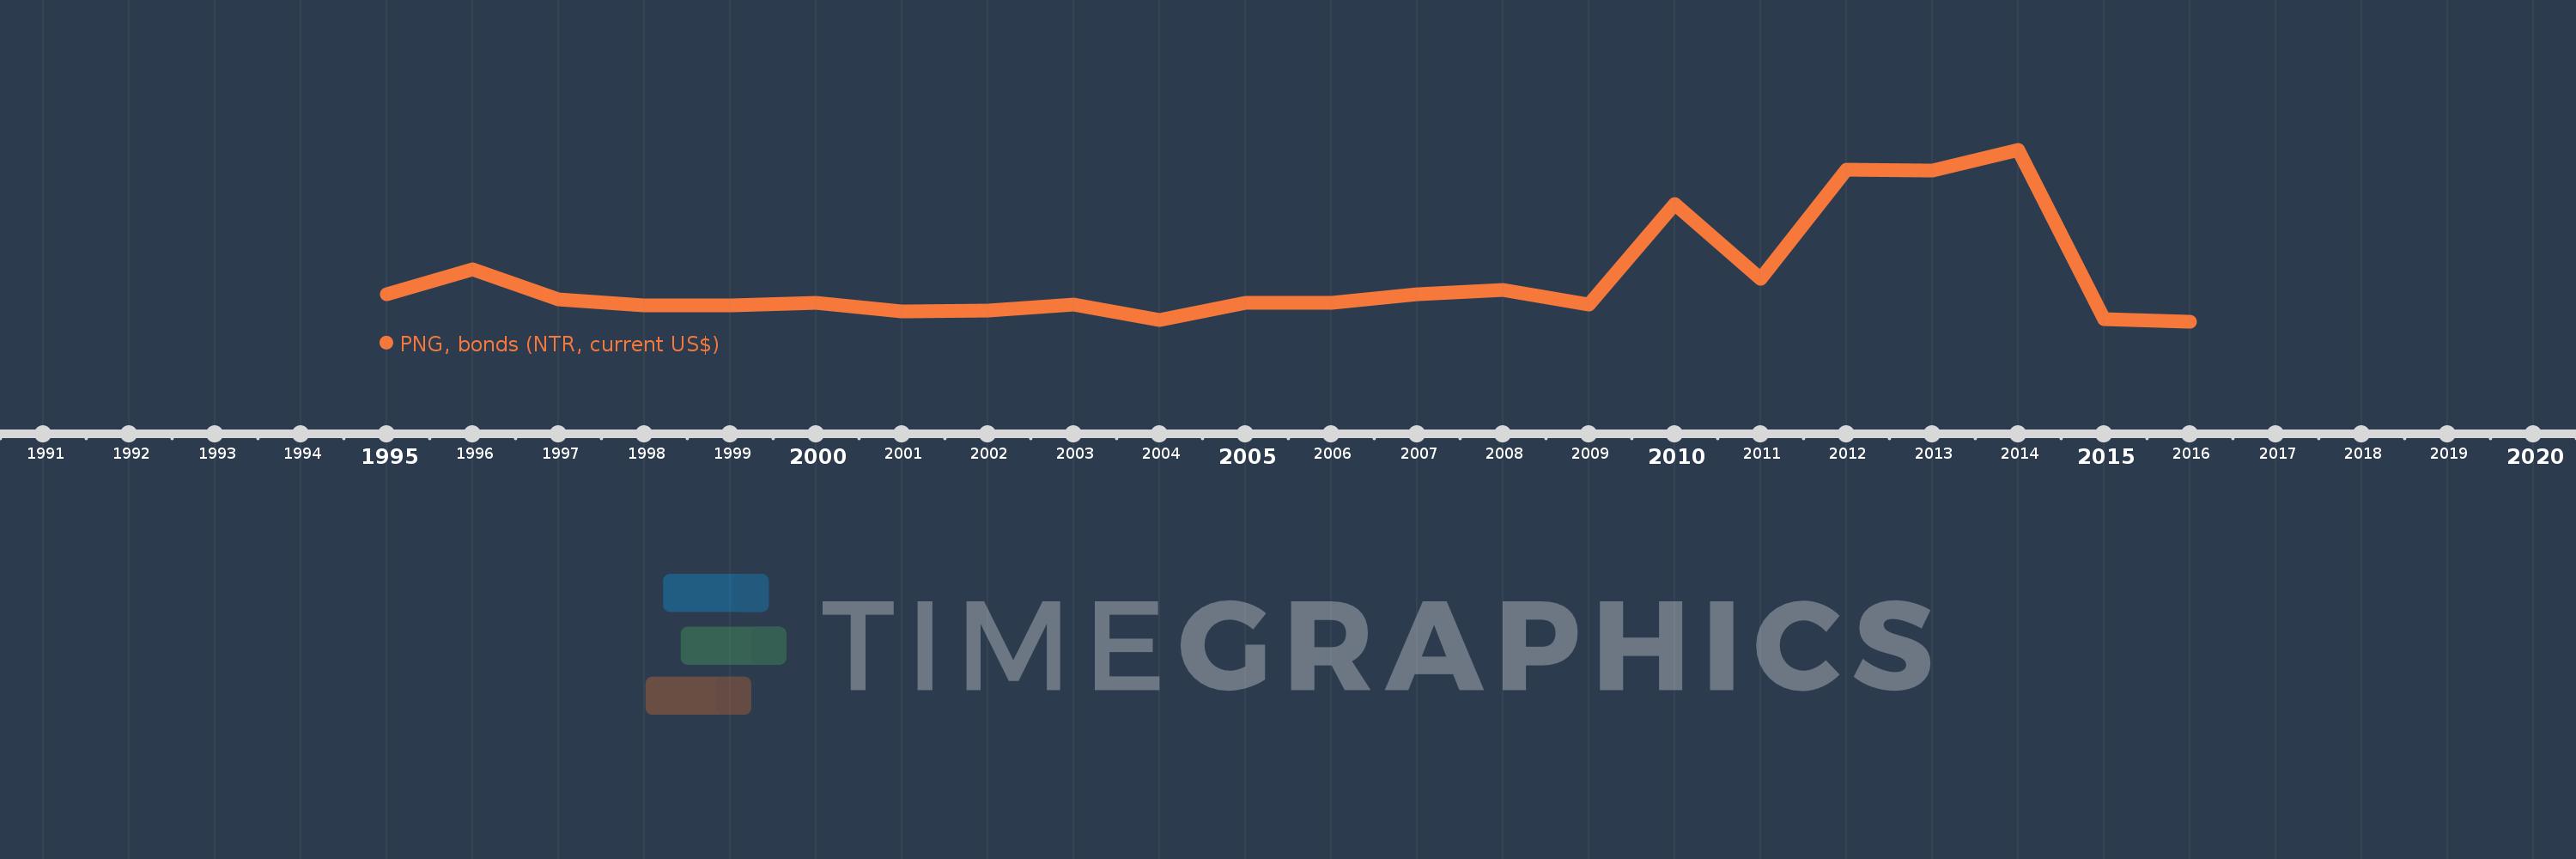
Timeline:
This timeline shows a graph from
1995
to
2016
of Colombia. No data until
1994
. Number of actual observations by date:
22
.
Source name:
World Development Indicators
Source organization:
World Bank, International Debt Statistics.
Categories, topics:
External Debt
Last updated:
apr 23, 2017
Indicators value changes by year
Meaning:
405.75 mln
Minimum:
-390.096 mln
jan 1, 2016
Maximum:
2.767 bln
jan 1, 2014
At the date of observation
Value
Absolute change
Change from the previous value
jan 1, 1995
125.0 mln
+125.0 mln
0.0%
jan 1, 1996
576.896 mln
+451.896 mln
361.52%
jan 1, 1997
30.282 mln
-546.614 mln
-94.75%
jan 1, 1998
-81.806 mln
-112.088 mln
-370.15%
jan 1, 1999
-81.582 mln
+224.0K
-0.27%
jan 1, 2000
-31.615 mln
+49.967 mln
-61.25%
jan 1, 2001
-194.161 mln
-162.546 mln
514.14%
jan 1, 2002
-177.209 mln
+16.952 mln
-8.73%
jan 1, 2003
-75.166 mln
+102.043 mln
-57.58%
jan 1, 2004
-357.096 mln
-281.93 mln
375.08%
jan 1, 2005
-43.762 mln
+313.334 mln
-87.75%
jan 1, 2006
-35.894 mln
+7.868 mln
-17.98%
jan 1, 2007
127.306 mln
+163.2 mln
-454.67%
jan 1, 2008
193.946 mln
+66.64 mln
52.35%
jan 1, 2009
-68.096 mln
-262.042 mln
-135.11%
jan 1, 2010
1.771 bln
+1.839 bln
-2.7K%
jan 1, 2011
398.908 mln
-1.372 bln
-77.48%
jan 1, 2012
2.412 bln
+2.013 bln
504.55%
jan 1, 2013
2.398 bln
-13.847 mln
-0.57%
jan 1, 2014
2.767 bln
+368.814 mln
15.38%
jan 1, 2015
-336.322 mln
-3.103 bln
-112.16%
jan 1, 2016
-390.096 mln
-53.774 mln
15.99%
Ranking of countries by current statistics by years
About & Feedback
Terms
Privacy
FAQ
Support 24/7
Cabinet
Get premium
Donate
The service accepts bank transfer (ACH, Wire) or cards (Visa, MasterCard, etc). Processed by Stripe.
Secured with SSL