Download This statistics in other country:
Timeline:
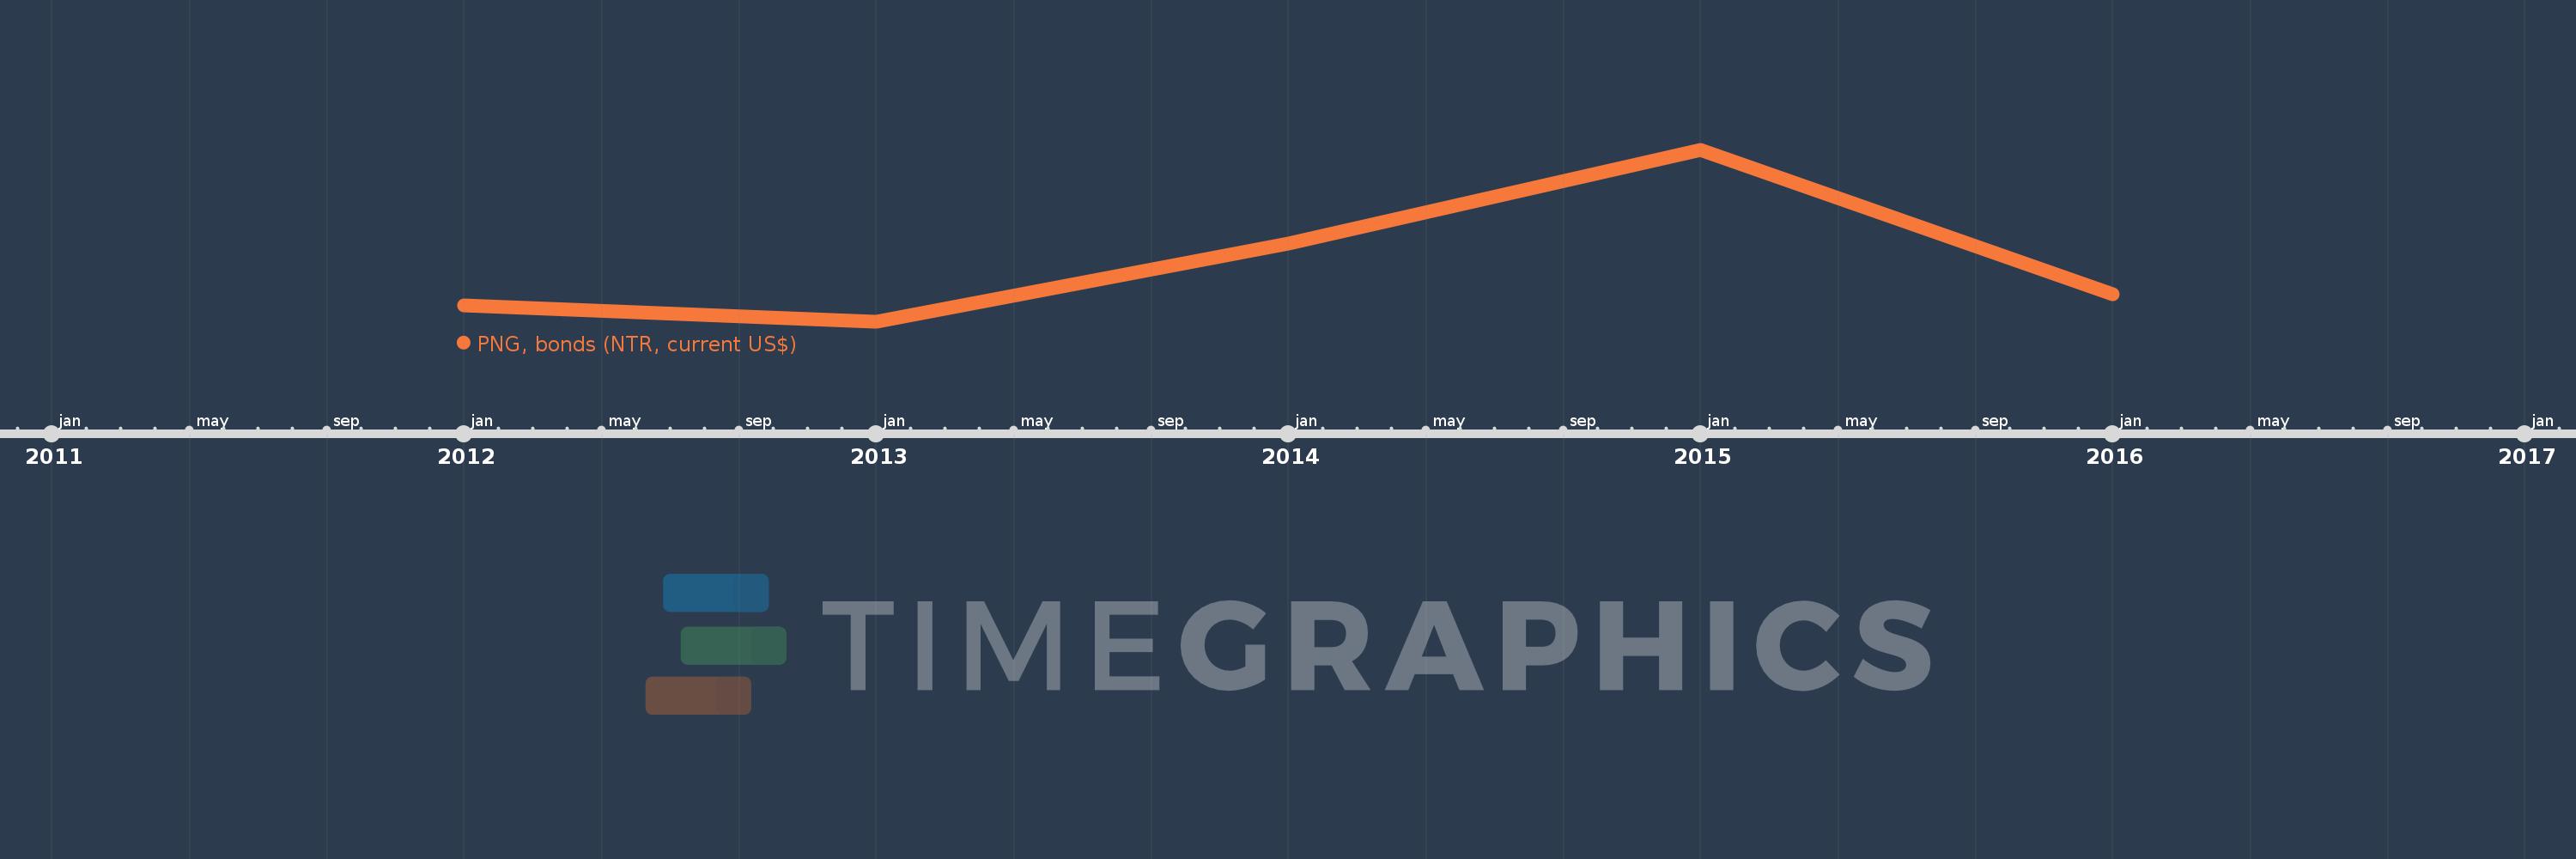
This timeline shows a graph from 2012 to 2016 of Nigeria. No data until 2011. Number of actual observations by date: 5.
Source name:
World Development Indicators
Source organization:
World Bank, International Debt Statistics.
Categories, topics:
External Debt
Last updated:
apr 23, 2017
Indicators value changes by year
Minimum:
299.812 mln
jan 1, 2013
Maximum:
2.209 bln
jan 1, 2015
At the date of observation
Value
Absolute change
Change from the previous value
jan 1, 2012
481.25 mln
+481.25 mln
0.0%
jan 1, 2013
299.812 mln
-181.438 mln
-37.7%
jan 1, 2014
1.176 bln
+876.126 mln
292.23%
jan 1, 2015
2.209 bln
+1.033 bln
87.87%
jan 1, 2016
607.096 mln
-1.602 bln
-72.52%
Ranking of countries by current statistics by years