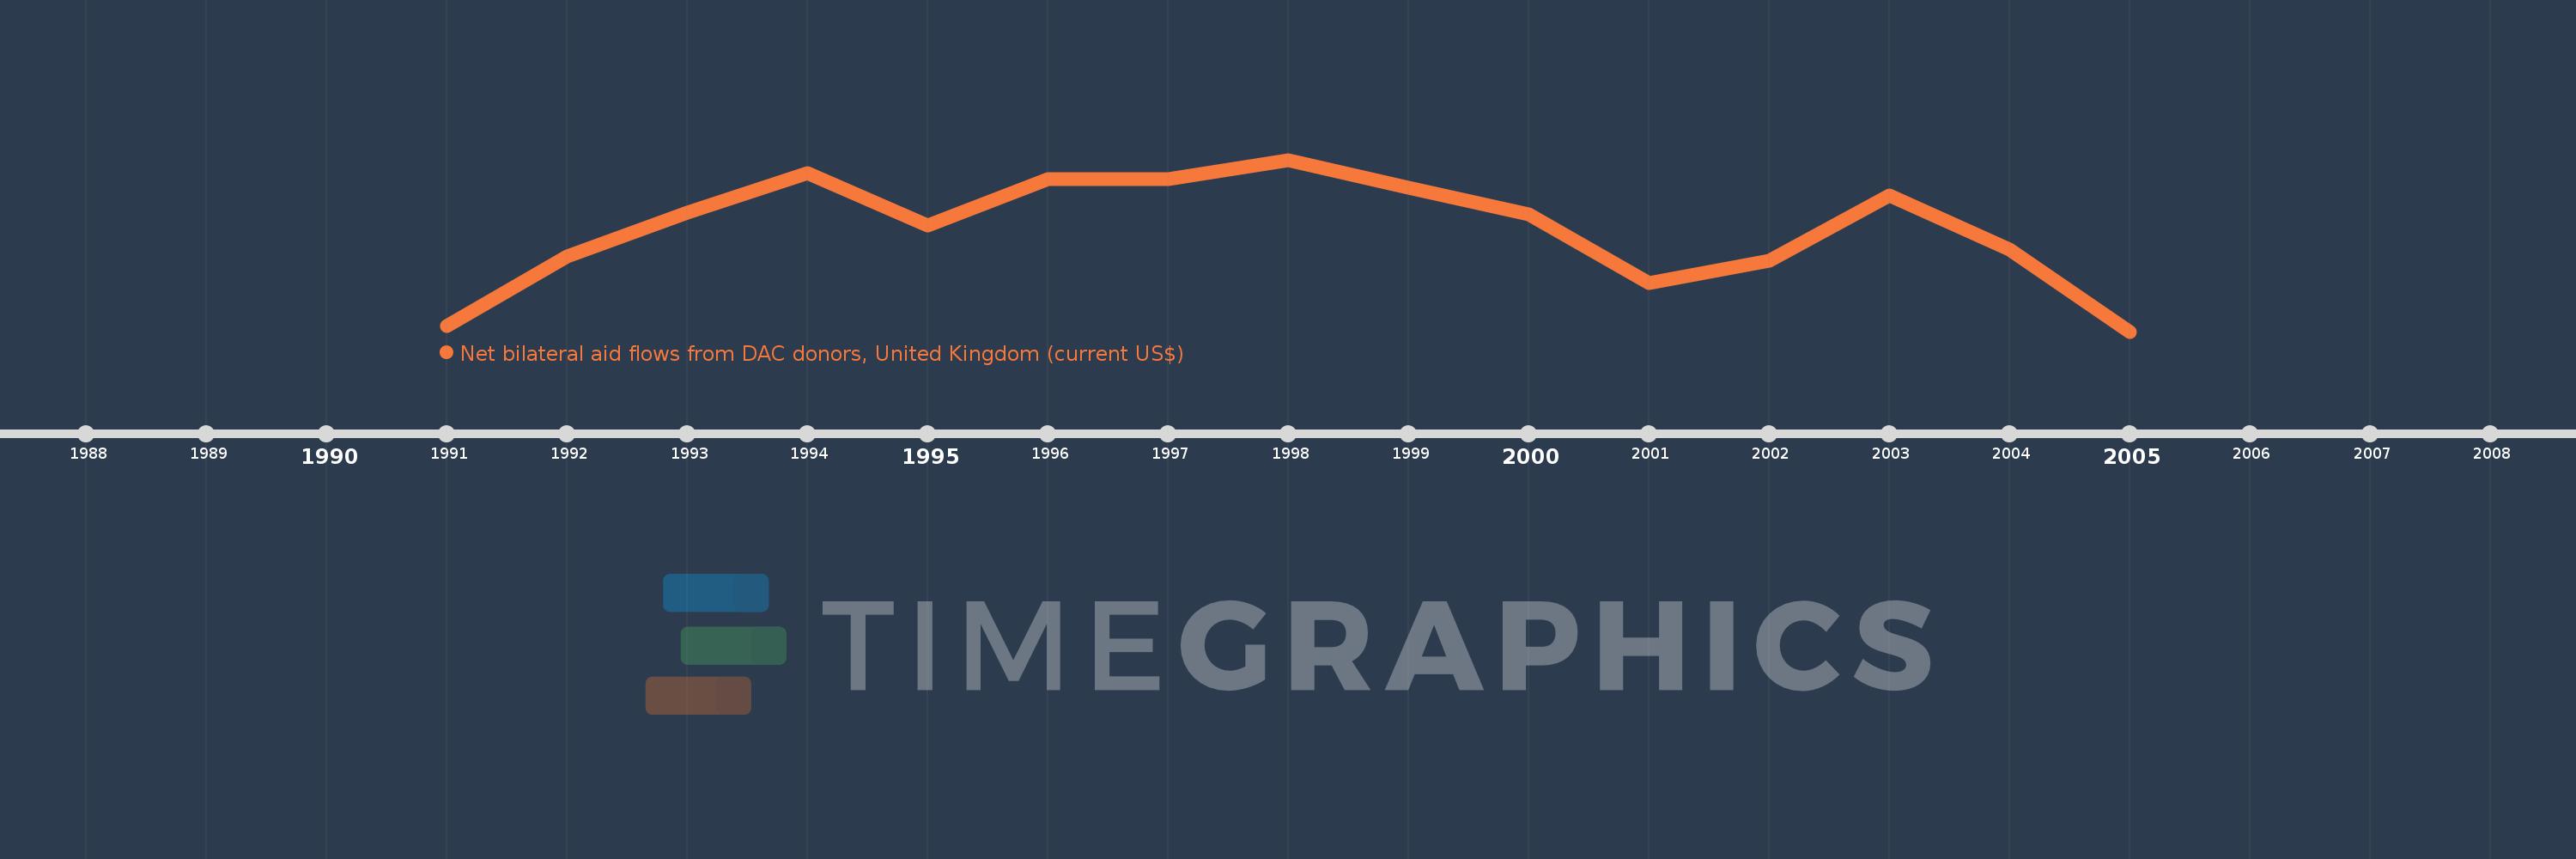
This timeline shows a graph from 1991 to 2005 of Slovak Republic. No data until 1990. Number of actual observations by date: 15.
Source name:
World Development Indicators
Source organization:
Development Assistance Committee of the Organisation for Economic Co-operation and Development, Geographical Distribution of Financial Flows to Developing Countries, Development Co-operation Report, and International Development Statistics database. Data are available online at: www.oecd.org/dac/stats/idsonline.
Categories, topics:
Aid Effectiveness
Last updated:
apr 23, 2017
Indicators value changes by year
Meaning:
3.272 mln
Minimum:
20.0K
jan 1, 2005
Maximum:
5.46 mln
jan 1, 1998
At the date of observation
Value
Absolute change
Change from the previous value
jan 1, 1991
200.0K
+200.0K
0.0%
jan 1, 1992
2.4 mln
+2.2 mln
1.1K%
jan 1, 1993
3.8 mln
+1.4 mln
58.33%
jan 1, 1994
5.03 mln
+1.23 mln
32.37%
jan 1, 1995
3.39 mln
-1.64 mln
-32.6%
jan 1, 1996
4.86 mln
+1.47 mln
43.36%
jan 1, 1997
4.86 mln
0.0
0.0%
jan 1, 1998
5.46 mln
+600.0K
12.35%
jan 1, 1999
4.57 mln
-890.0K
-16.3%
jan 1, 2000
3.72 mln
-850.0K
-18.6%
jan 1, 2001
1.56 mln
-2.16 mln
-58.06%
jan 1, 2002
2.26 mln
+700.0K
44.87%
jan 1, 2003
4.34 mln
+2.08 mln
92.04%
jan 1, 2004
2.61 mln
-1.73 mln
-39.86%
jan 1, 2005
20.0K
-2.59 mln
-99.23%
Ranking of countries by current statistics by years