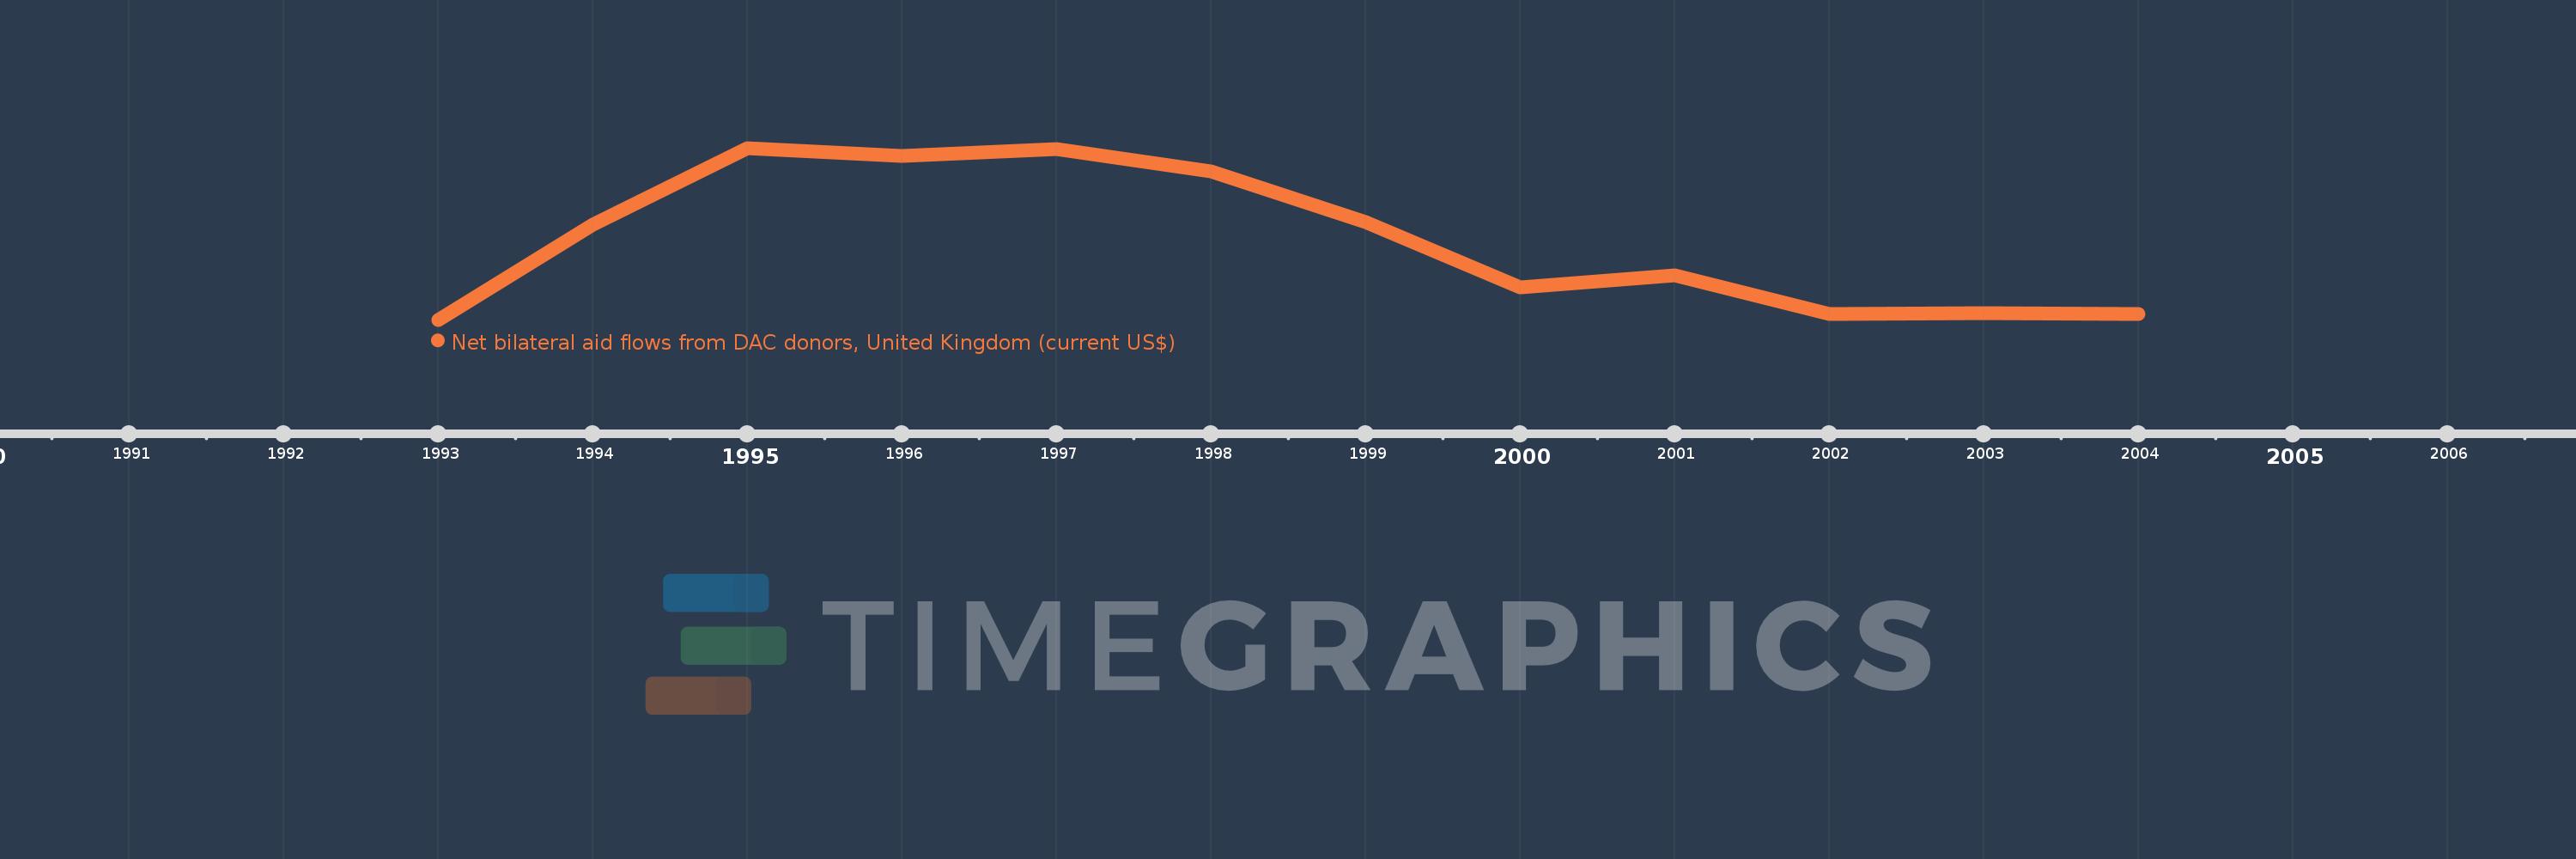
This timeline shows a graph from 1993 to 2004 of Latvia. No data until 1992. Number of actual observations by date: 12.
Source name:
World Development Indicators
Source organization:
Development Assistance Committee of the Organisation for Economic Co-operation and Development, Geographical Distribution of Financial Flows to Developing Countries, Development Co-operation Report, and International Development Statistics database. Data are available online at: www.oecd.org/dac/stats/idsonline.
Categories, topics:
Aid Effectiveness
Last updated:
apr 23, 2017
Indicators value changes by year
Meaning:
621.667K
Minimum:
60.0K
jan 1, 1993
Maximum:
1.29 mln
jan 1, 1995
At the date of observation
Value
Absolute change
Change from the previous value
jan 1, 1993
60.0K
+60.0K
0.0%
jan 1, 1994
740.0K
+680.0K
1.13K%
jan 1, 1995
1.29 mln
+550.0K
74.32%
jan 1, 1996
1.23 mln
-60.0K
-4.65%
jan 1, 1997
1.28 mln
+50.0K
4.07%
jan 1, 1998
1.12 mln
-160.0K
-12.5%
jan 1, 1999
760.0K
-360.0K
-32.14%
jan 1, 2000
290.0K
-470.0K
-61.84%
jan 1, 2001
380.0K
+90.0K
31.03%
jan 1, 2002
100.0K
-280.0K
-73.68%
jan 1, 2003
110.0K
+10.0K
10.0%
jan 1, 2004
100.0K
-10.0K
-9.09%
Ranking of countries by current statistics by years