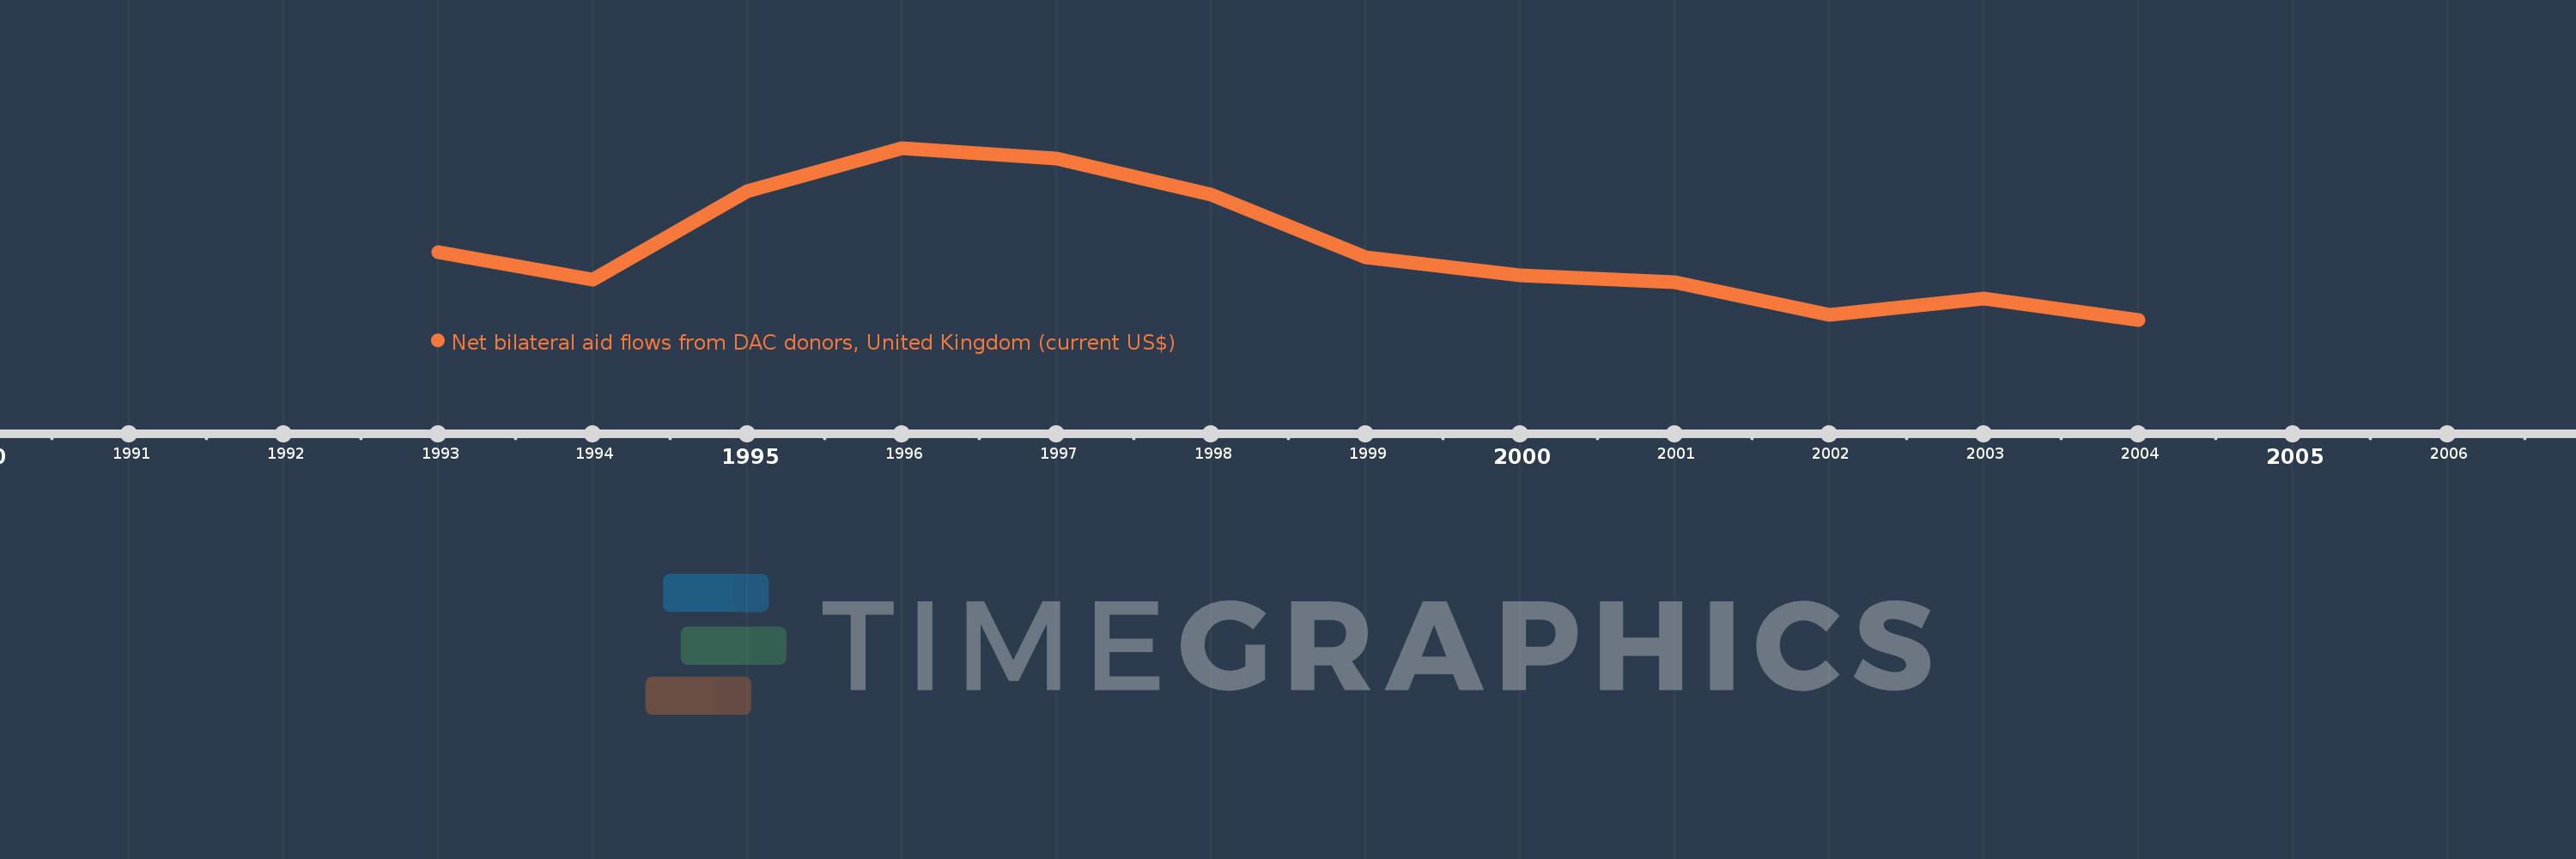
This timeline shows a graph from 1993 to 2004 of Estonia. No data until 1992. Number of actual observations by date: 12.
Source name:
World Development Indicators
Source organization:
Development Assistance Committee of the Organisation for Economic Co-operation and Development, Geographical Distribution of Financial Flows to Developing Countries, Development Co-operation Report, and International Development Statistics database. Data are available online at: www.oecd.org/dac/stats/idsonline.
Categories, topics:
Aid Effectiveness
Last updated:
apr 23, 2017
Indicators value changes by year
Meaning:
604.167K
Minimum:
50.0K
jan 1, 2004
Maximum:
1.37 mln
jan 1, 1996
At the date of observation
Value
Absolute change
Change from the previous value
jan 1, 1993
570.0K
+570.0K
0.0%
jan 1, 1994
360.0K
-210.0K
-36.84%
jan 1, 1995
1.04 mln
+680.0K
188.89%
jan 1, 1996
1.37 mln
+330.0K
31.73%
jan 1, 1997
1.29 mln
-80.0K
-5.84%
jan 1, 1998
1.01 mln
-280.0K
-21.71%
jan 1, 1999
530.0K
-480.0K
-47.52%
jan 1, 2000
390.0K
-140.0K
-26.42%
jan 1, 2001
340.0K
-50.0K
-12.82%
jan 1, 2002
90.0K
-250.0K
-73.53%
jan 1, 2003
210.0K
+120.0K
133.33%
jan 1, 2004
50.0K
-160.0K
-76.19%
Ranking of countries by current statistics by years