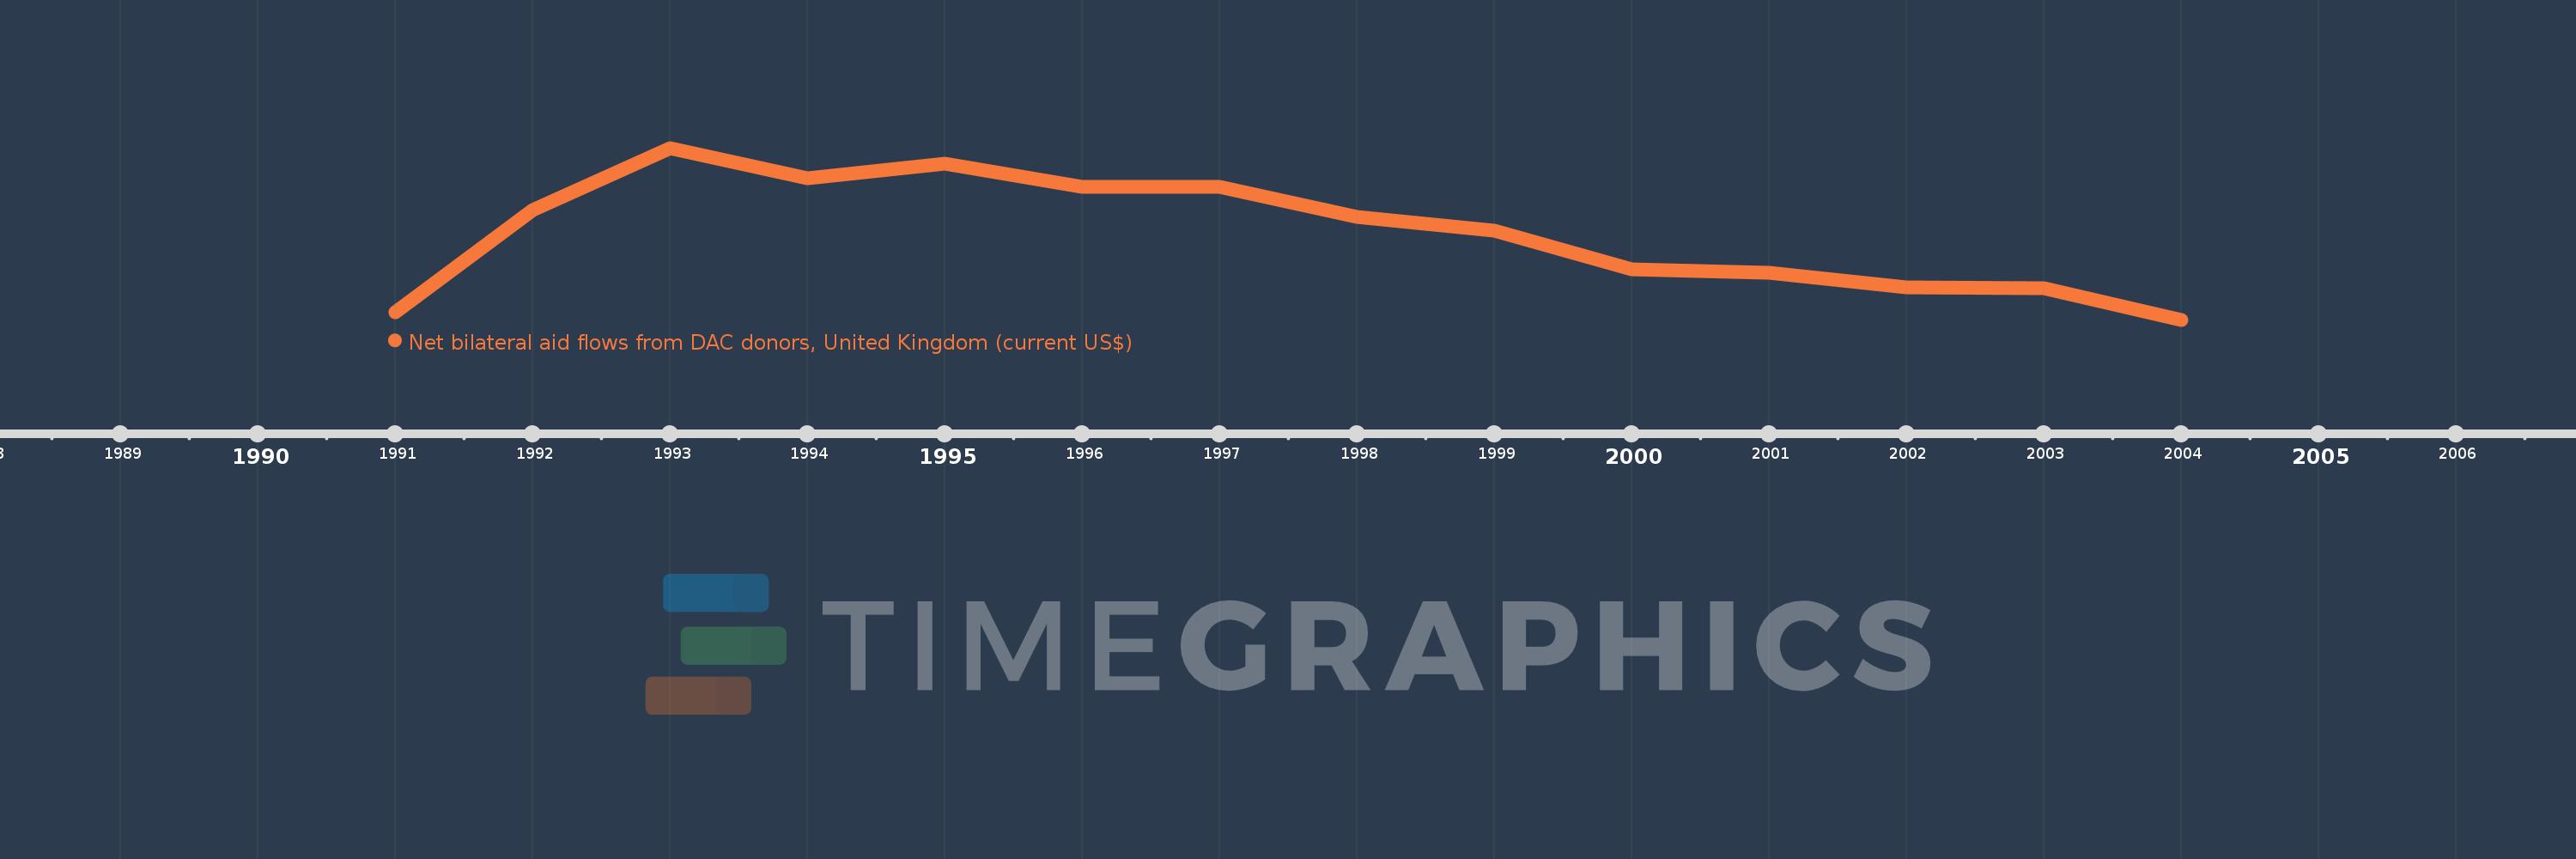
This timeline shows a graph from 1991 to 2004 of Hungary. No data until 1990. Number of actual observations by date: 14.
Source name:
World Development Indicators
Source organization:
Development Assistance Committee of the Organisation for Economic Co-operation and Development, Geographical Distribution of Financial Flows to Developing Countries, Development Co-operation Report, and International Development Statistics database. Data are available online at: www.oecd.org/dac/stats/idsonline.
Categories, topics:
Aid Effectiveness
Last updated:
apr 23, 2017
Indicators value changes by year
Meaning:
5.369 mln
Minimum:
730.0K
jan 1, 2004
Maximum:
9.99 mln
jan 1, 1993
At the date of observation
Value
Absolute change
Change from the previous value
jan 1, 1991
1.11 mln
+1.11 mln
0.0%
jan 1, 1992
6.65 mln
+5.54 mln
499.1%
jan 1, 1993
9.99 mln
+3.34 mln
50.23%
jan 1, 1994
8.36 mln
-1.63 mln
-16.32%
jan 1, 1995
9.13 mln
+770.0K
9.21%
jan 1, 1996
7.91 mln
-1.22 mln
-13.36%
jan 1, 1997
7.88 mln
-30.0K
-0.38%
jan 1, 1998
6.26 mln
-1.62 mln
-20.56%
jan 1, 1999
5.55 mln
-710.0K
-11.34%
jan 1, 2000
3.45 mln
-2.1 mln
-37.84%
jan 1, 2001
3.25 mln
-200.0K
-5.8%
jan 1, 2002
2.47 mln
-780.0K
-24.0%
jan 1, 2003
2.42 mln
-50.0K
-2.02%
jan 1, 2004
730.0K
-1.69 mln
-69.83%
Ranking of countries by current statistics by years