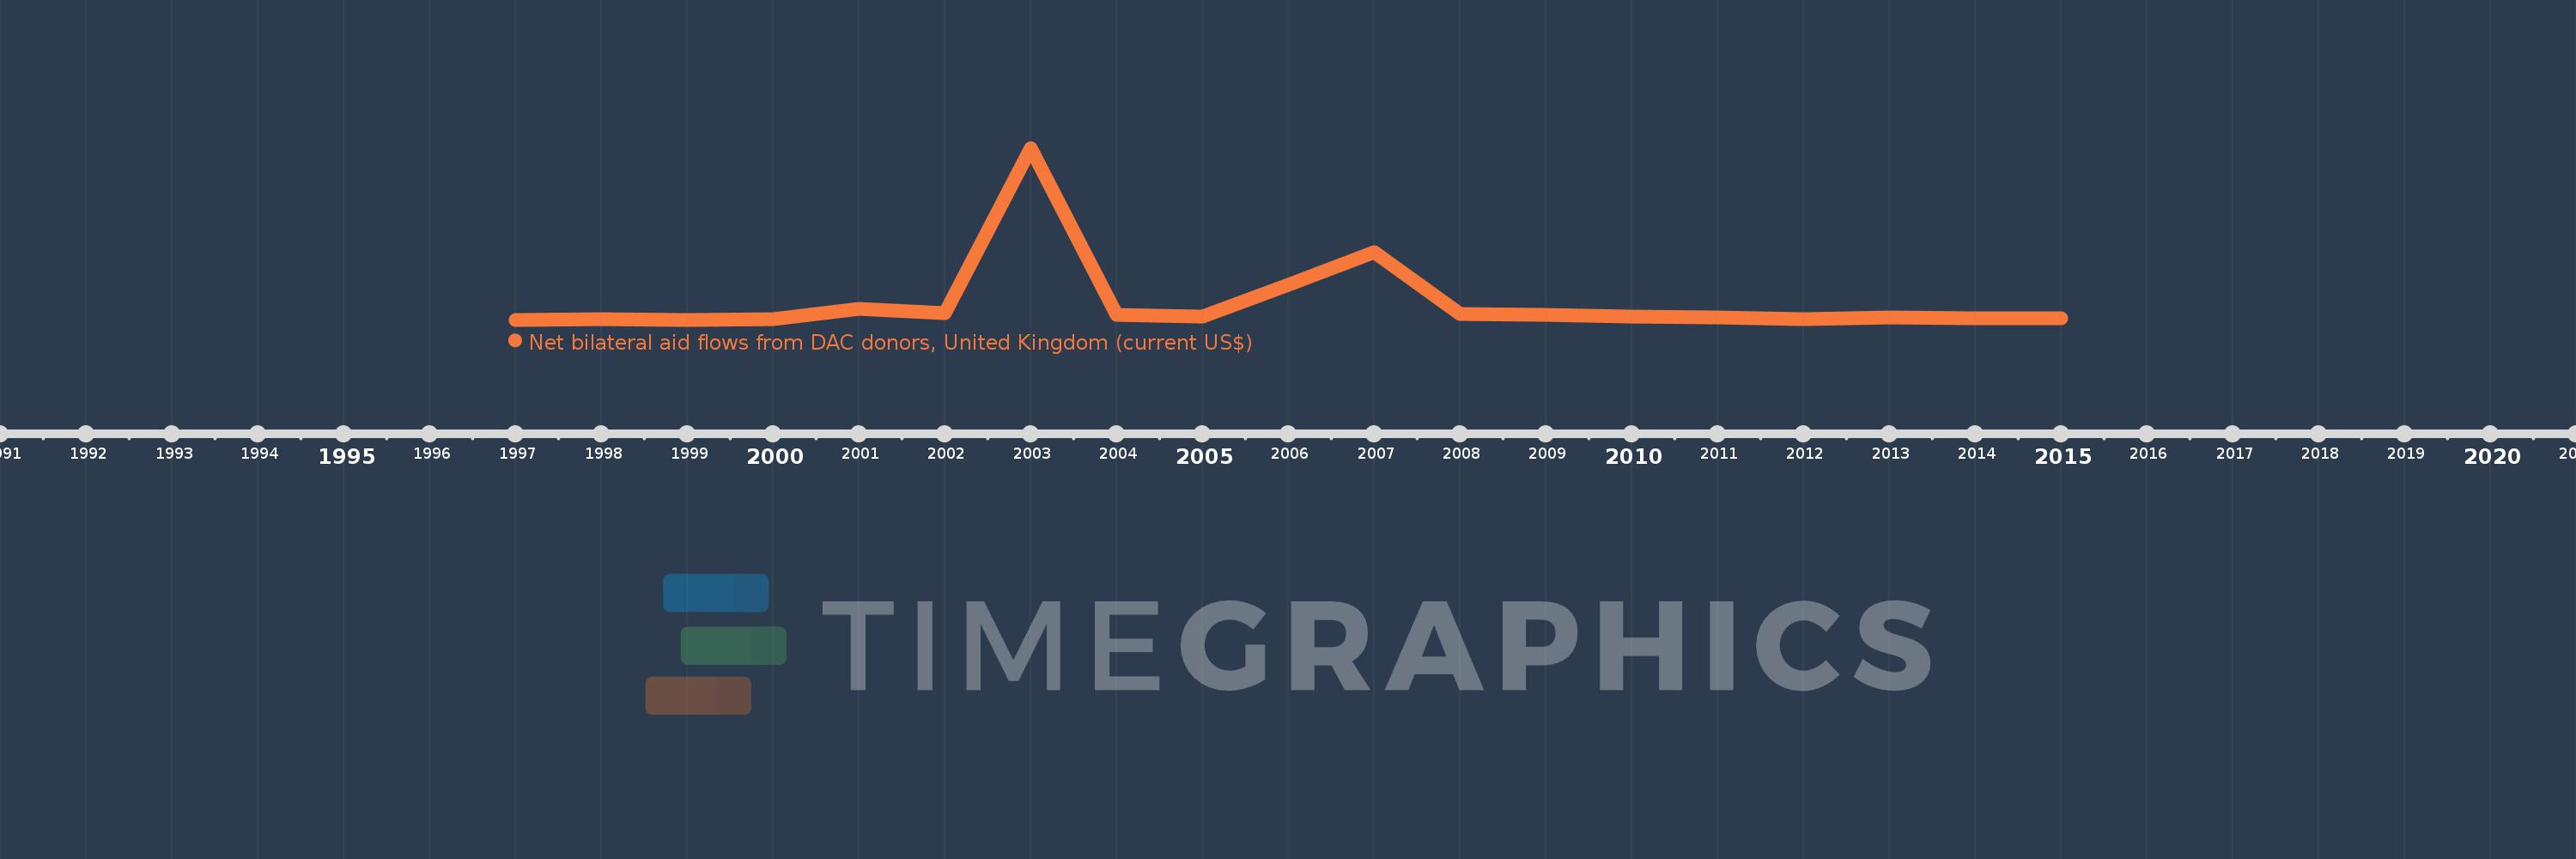
This timeline shows a graph from 1997 to 2015 of Serbia. No data until 1996. Number of actual observations by date: 19.
Source name:
World Development Indicators
Source organization:
Development Assistance Committee of the Organisation for Economic Co-operation and Development, Geographical Distribution of Financial Flows to Developing Countries, Development Co-operation Report, and International Development Statistics database. Data are available online at: www.oecd.org/dac/stats/idsonline.
Categories, topics:
Aid Effectiveness
Last updated:
apr 23, 2017
Indicators value changes by year
Meaning:
45.382 mln
Minimum:
40.0K
jan 1, 1997
Maximum:
459.74 mln
jan 1, 2003
At the date of observation
Value
Absolute change
Change from the previous value
jan 1, 1997
40.0K
+40.0K
0.0%
jan 1, 1998
750.0K
+710.0K
1.77K%
jan 1, 1999
210.0K
-540.0K
-72.0%
jan 1, 2000
1.13 mln
+920.0K
438.1%
jan 1, 2001
28.29 mln
+27.16 mln
2.4K%
jan 1, 2002
17.02 mln
-11.27 mln
-39.84%
jan 1, 2003
459.74 mln
+442.72 mln
2.6K%
jan 1, 2004
13.68 mln
-446.06 mln
-97.02%
jan 1, 2005
9.64 mln
-4.04 mln
-29.53%
jan 1, 2006
93.0 mln
+83.36 mln
864.73%
jan 1, 2007
180.49 mln
+87.49 mln
94.08%
jan 1, 2008
15.47 mln
-165.02 mln
-91.43%
jan 1, 2009
12.05 mln
-3.42 mln
-22.11%
jan 1, 2010
7.72 mln
-4.33 mln
-35.93%
jan 1, 2011
5.4 mln
-2.32 mln
-30.05%
jan 1, 2012
2.43 mln
-2.97 mln
-55.0%
jan 1, 2013
5.2 mln
+2.77 mln
113.99%
jan 1, 2014
5.06 mln
-140.0K
-2.69%
jan 1, 2015
4.93 mln
-130.0K
-2.57%
Ranking of countries by current statistics by years