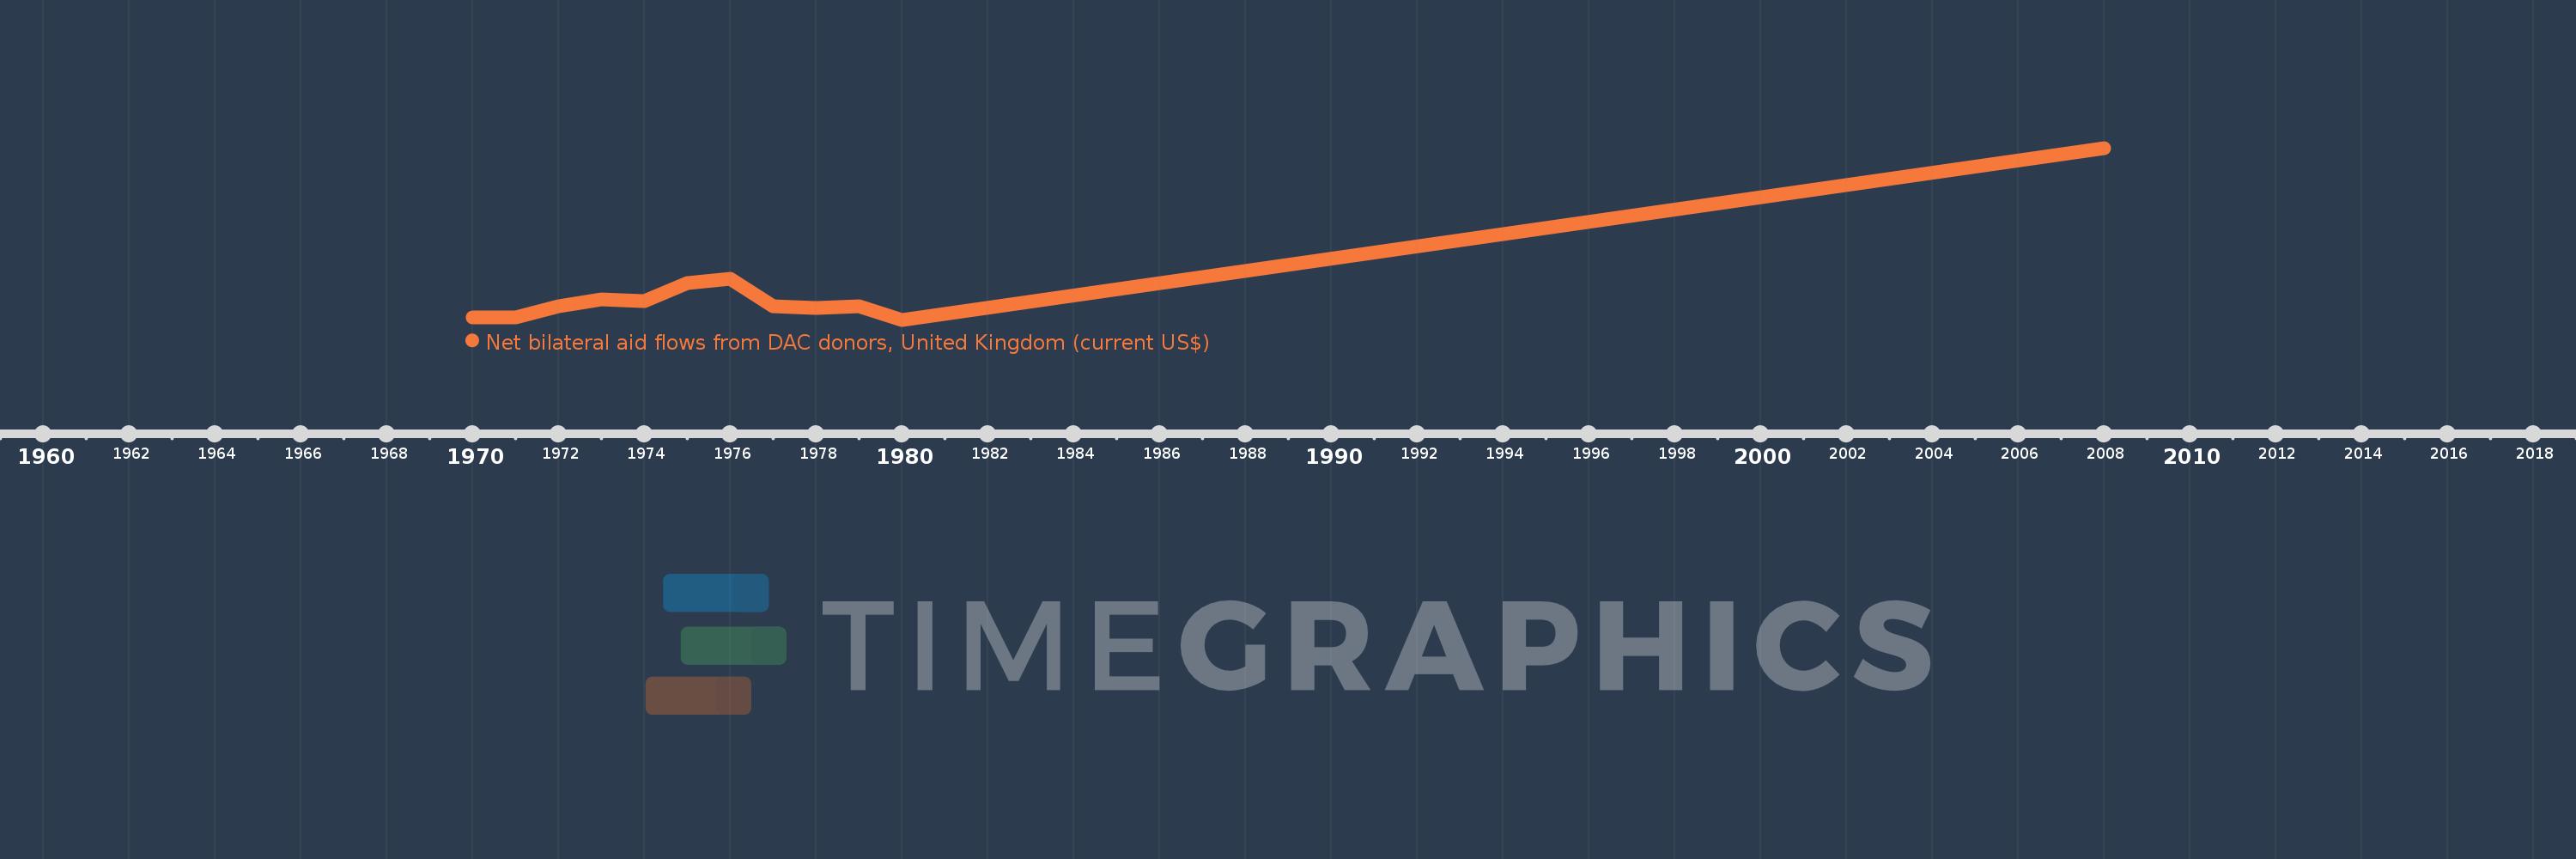
This timeline shows a graph from 1970 to 2008 of Saudi Arabia. No data until 1969. Number of actual observations by date: 12.
Source name:
World Development Indicators
Source organization:
Development Assistance Committee of the Organisation for Economic Co-operation and Development, Geographical Distribution of Financial Flows to Developing Countries, Development Co-operation Report, and International Development Statistics database. Data are available online at: www.oecd.org/dac/stats/idsonline.
Categories, topics:
Aid Effectiveness
Last updated:
apr 23, 2017
Indicators value changes by year
Meaning:
135.833K
Minimum:
10.0K
jan 1, 1980
Maximum:
760.0K
jan 1, 2008
At the date of observation
Value
Absolute change
Change from the previous value
jan 1, 1970
20.0K
+20.0K
0.0%
jan 1, 1971
20.0K
0.0
0.0%
jan 1, 1972
70.0K
+50.0K
250.0%
jan 1, 1973
100.0K
+30.0K
42.86%
jan 1, 1974
90.0K
-10.0K
-10.0%
jan 1, 1975
170.0K
+80.0K
88.89%
jan 1, 1976
190.0K
+20.0K
11.76%
jan 1, 1977
70.0K
-120.0K
-63.16%
jan 1, 1978
60.0K
-10.0K
-14.29%
jan 1, 1979
70.0K
+10.0K
16.67%
jan 1, 1980
10.0K
-60.0K
-85.71%
jan 1, 2008
760.0K
+750.0K
7.5K%
Ranking of countries by current statistics by years