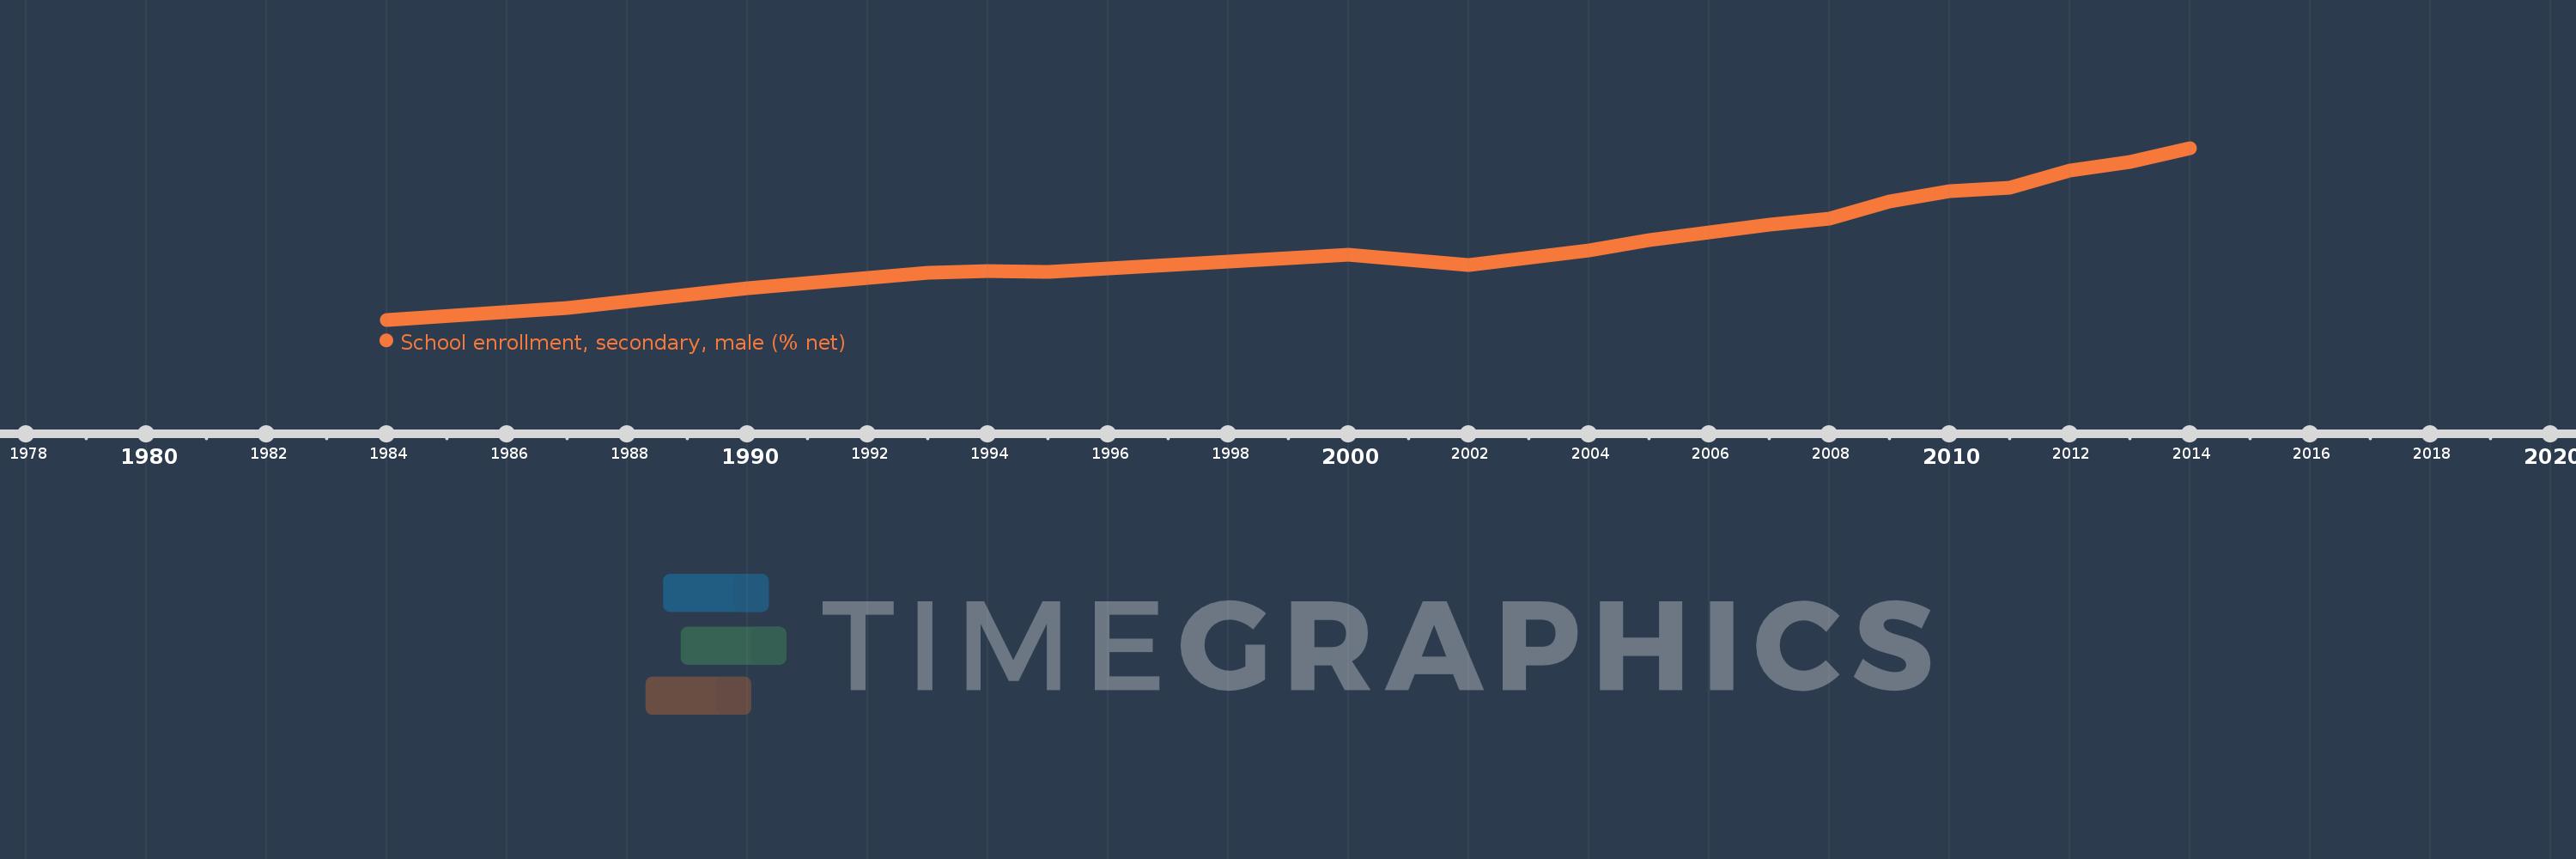
Questa scala temporale mostra un grafico dal 1984 anno al 2014 anno. Burkina Faso. I dati fino ad 1983 anno non disponibili. Il numero di osservazioni attuali secondo i date: 19.
La fonte (nome):
Indicatori dello sviluppo mondiale
La fonte (organizzazione):
United Nations Educational, Scientific, and Cultural Organization (UNESCO) Institute for Statistics.
Categorie:
Education, Gender
sono stati aggiornati
23 apr 2017 anni
Indicatori delle variazioni dei valori per anni
In media:
12.964
Minima:
3.247
1 gen 1984 anni
Massimo:
23.113
1 gen 2014 anni
Alla data di osservazione
Valore
Variazione assoluta
La variazione rispetto al valore precedente
1 gen 1984 anni
3.247
+3.247
0.0%
1 gen 1987 anni
4.597
+1.351
41.6%
1 gen 1990 anni
6.877
+2.28
49.59%
1 gen 1993 anni
8.648
+1.772
25.76%
1 gen 1994 anni
8.89
+0.241
2.79%
1 gen 1995 anni
8.766
-0.124
-1.39%
1 gen 2000 anni
10.773
+2.007
22.89%
1 gen 2002 anni
9.587
-1.186
-11.01%
1 gen 2004 anni
11.248
+1.661
17.33%
1 gen 2005 anni
12.491
+1.243
11.05%
1 gen 2006 anni
13.317
+0.826
6.61%
1 gen 2007 anni
14.207
+0.89
6.69%
1 gen 2008 anni
14.96
+0.753
5.3%
1 gen 2009 anni
16.969
+2.009
13.43%
1 gen 2010 anni
18.121
+1.152
6.79%
1 gen 2011 anni
18.506
+0.385
2.12%
1 gen 2012 anni
20.464
+1.958
10.58%
1 gen 2013 anni
21.542
+1.079
5.27%
1 gen 2014 anni
23.113
+1.571
7.29%
Classificazione dei paesi secondo i statistiche attuali per anni