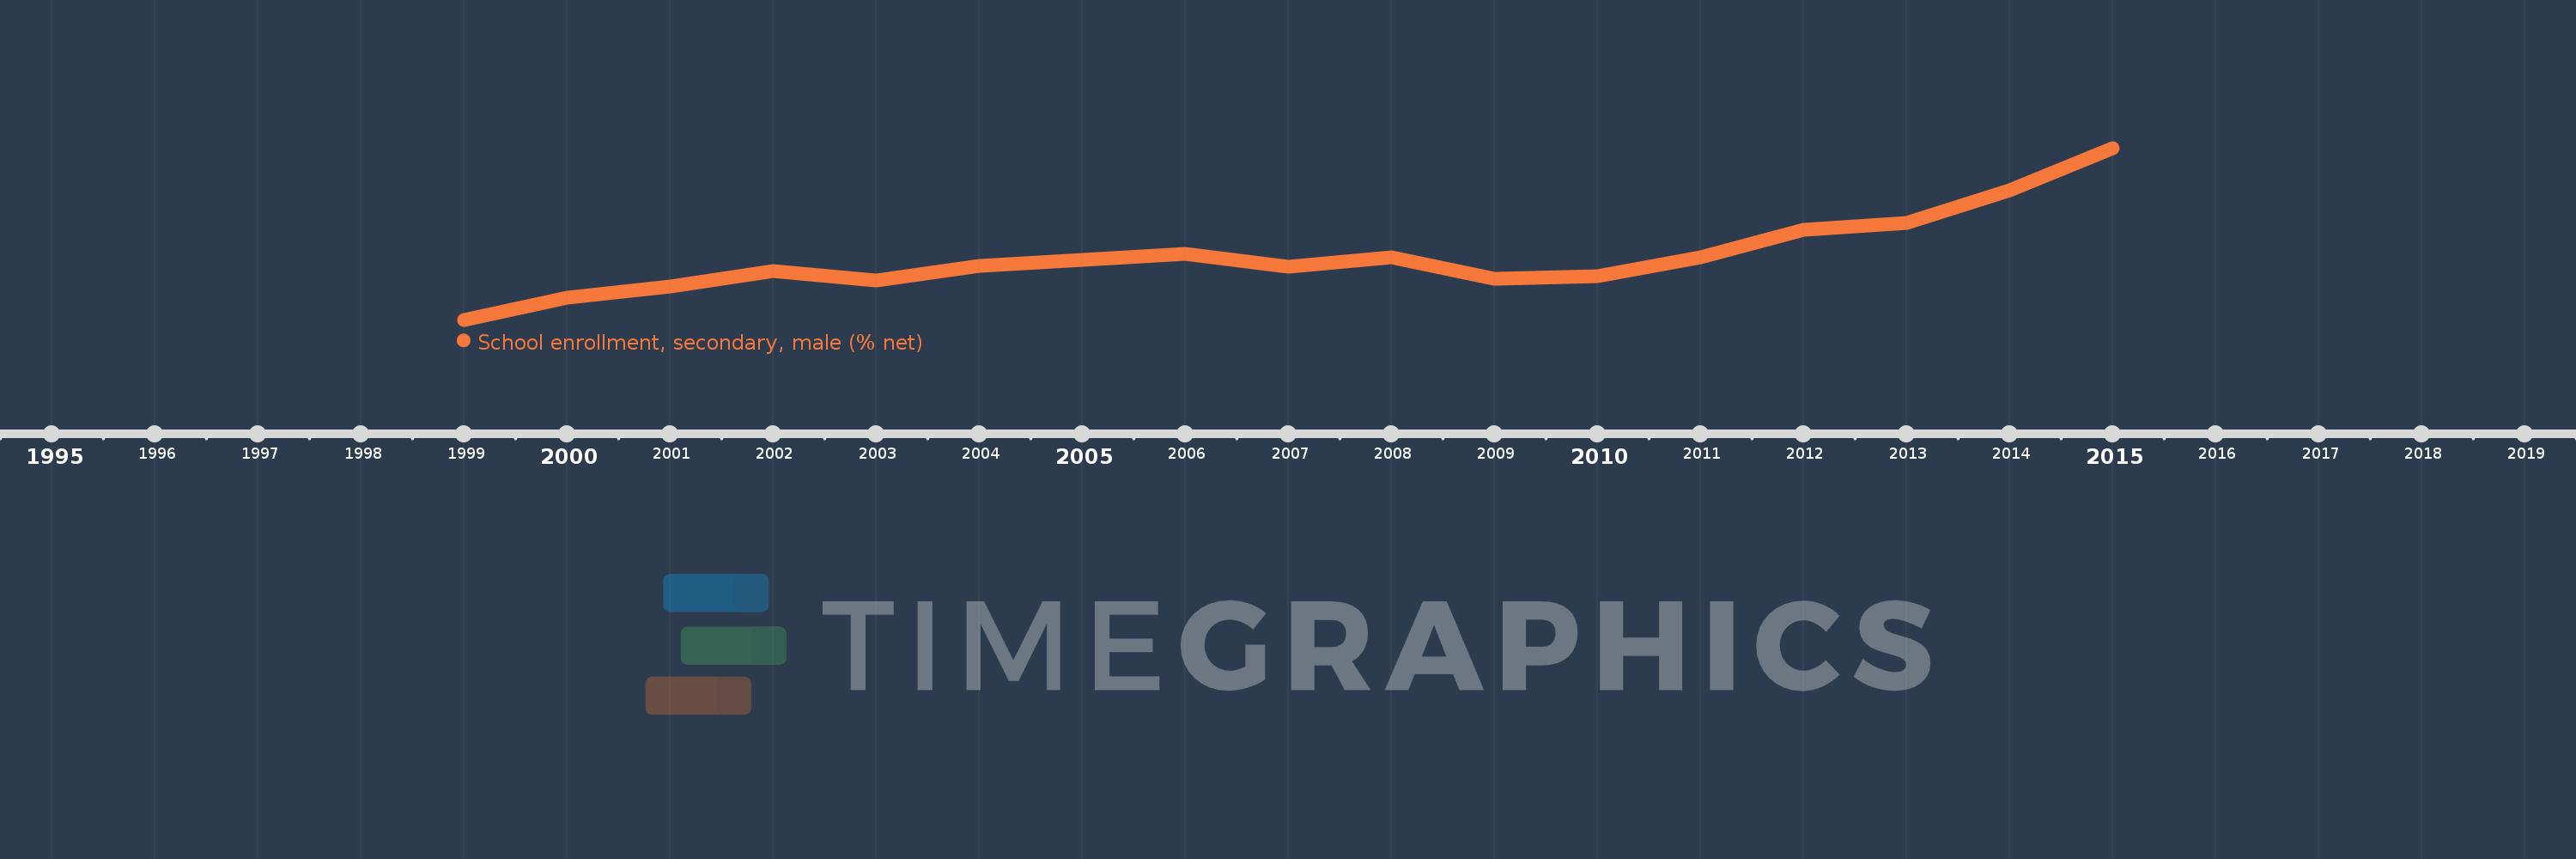
Questa scala temporale mostra un grafico dal 1999 anno al 2015 anno. East Asia & Pacific (excluding high income). I dati fino ad 1998 anno non disponibili. Il numero di osservazioni attuali secondo i date: 16.
La fonte (nome):
Indicatori dello sviluppo mondiale
La fonte (organizzazione):
United Nations Educational, Scientific, and Cultural Organization (UNESCO) Institute for Statistics.
Categorie:
Education, Gender
sono stati aggiornati
23 apr 2017 anni
Indicatori delle variazioni dei valori per anni
In media:
67.456
Minima:
63.665
1 gen 1999 anni
Massimo:
73.949
1 gen 2015 anni
Alla data di osservazione
Valore
Variazione assoluta
La variazione rispetto al valore precedente
1 gen 1999 anni
63.665
+63.665
0.0%
1 gen 2000 anni
64.969
+1.304
2.05%
1 gen 2001 anni
65.671
+0.702
1.08%
1 gen 2002 anni
66.567
+0.896
1.37%
1 gen 2003 anni
66.034
-0.533
-0.8%
1 gen 2004 anni
66.871
+0.837
1.27%
1 gen 2006 anni
67.603
+0.732
1.09%
1 gen 2007 anni
66.829
-0.774
-1.14%
1 gen 2008 anni
67.39
+0.561
0.84%
1 gen 2009 anni
66.138
-1.252
-1.86%
1 gen 2010 anni
66.278
+0.14
0.21%
1 gen 2011 anni
67.385
+1.107
1.67%
1 gen 2012 anni
69.066
+1.681
2.49%
1 gen 2013 anni
69.475
+0.41
0.59%
1 gen 2014 anni
71.413
+1.938
2.79%
1 gen 2015 anni
73.949
+2.535
3.55%
Classificazione dei paesi secondo i statistiche attuali per anni