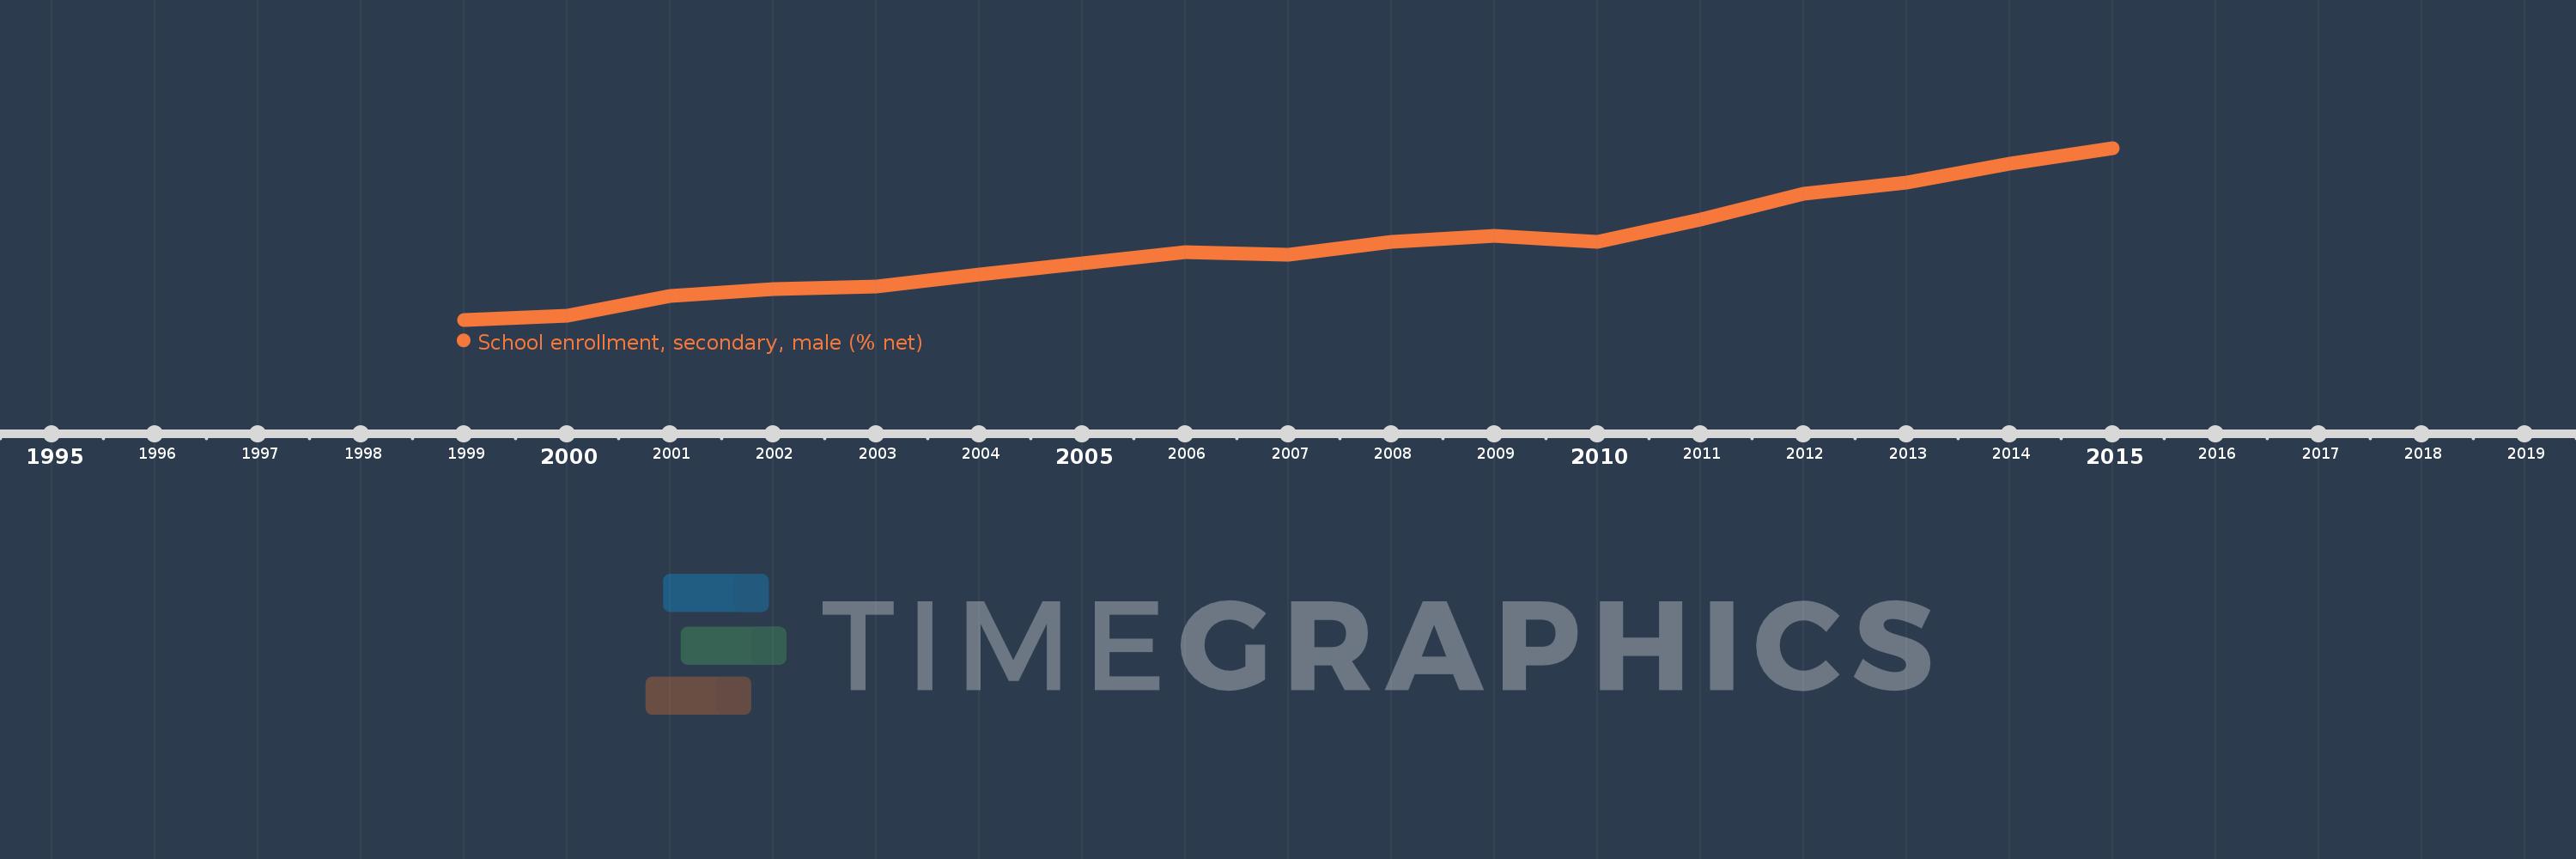
Questa scala temporale mostra un grafico dal 1999 anno al 2015 anno. IBRD only. I dati fino ad 1998 anno non disponibili. Il numero di osservazioni attuali secondo i date: 17.
La fonte (nome):
Indicatori dello sviluppo mondiale
La fonte (organizzazione):
United Nations Educational, Scientific, and Cultural Organization (UNESCO) Institute for Statistics.
Categorie:
Education, Gender
sono stati aggiornati
23 apr 2017 anni
Indicatori delle variazioni dei valori per anni
In media:
64.52
Minima:
59.922
1 gen 1999 anni
Massimo:
70.595
1 gen 2015 anni
Alla data di osservazione
Valore
Variazione assoluta
La variazione rispetto al valore precedente
1 gen 1999 anni
59.922
+59.922
0.0%
1 gen 2000 anni
60.164
+0.242
0.4%
1 gen 2001 anni
61.391
+1.227
2.04%
1 gen 2002 anni
61.822
+0.431
0.7%
1 gen 2003 anni
62.011
+0.188
0.3%
1 gen 2004 anni
62.709
+0.698
1.13%
1 gen 2005 anni
63.441
+0.732
1.17%
1 gen 2006 anni
64.13
+0.688
1.09%
1 gen 2007 anni
63.955
-0.174
-0.27%
1 gen 2008 anni
64.743
+0.787
1.23%
1 gen 2009 anni
65.128
+0.385
0.59%
1 gen 2010 anni
64.778
-0.35
-0.54%
1 gen 2011 anni
66.171
+1.393
2.15%
1 gen 2012 anni
67.76
+1.589
2.4%
1 gen 2013 anni
68.469
+0.709
1.05%
1 gen 2014 anni
69.643
+1.174
1.72%
1 gen 2015 anni
70.595
+0.951
1.37%
Classificazione dei paesi secondo i statistiche attuali per anni