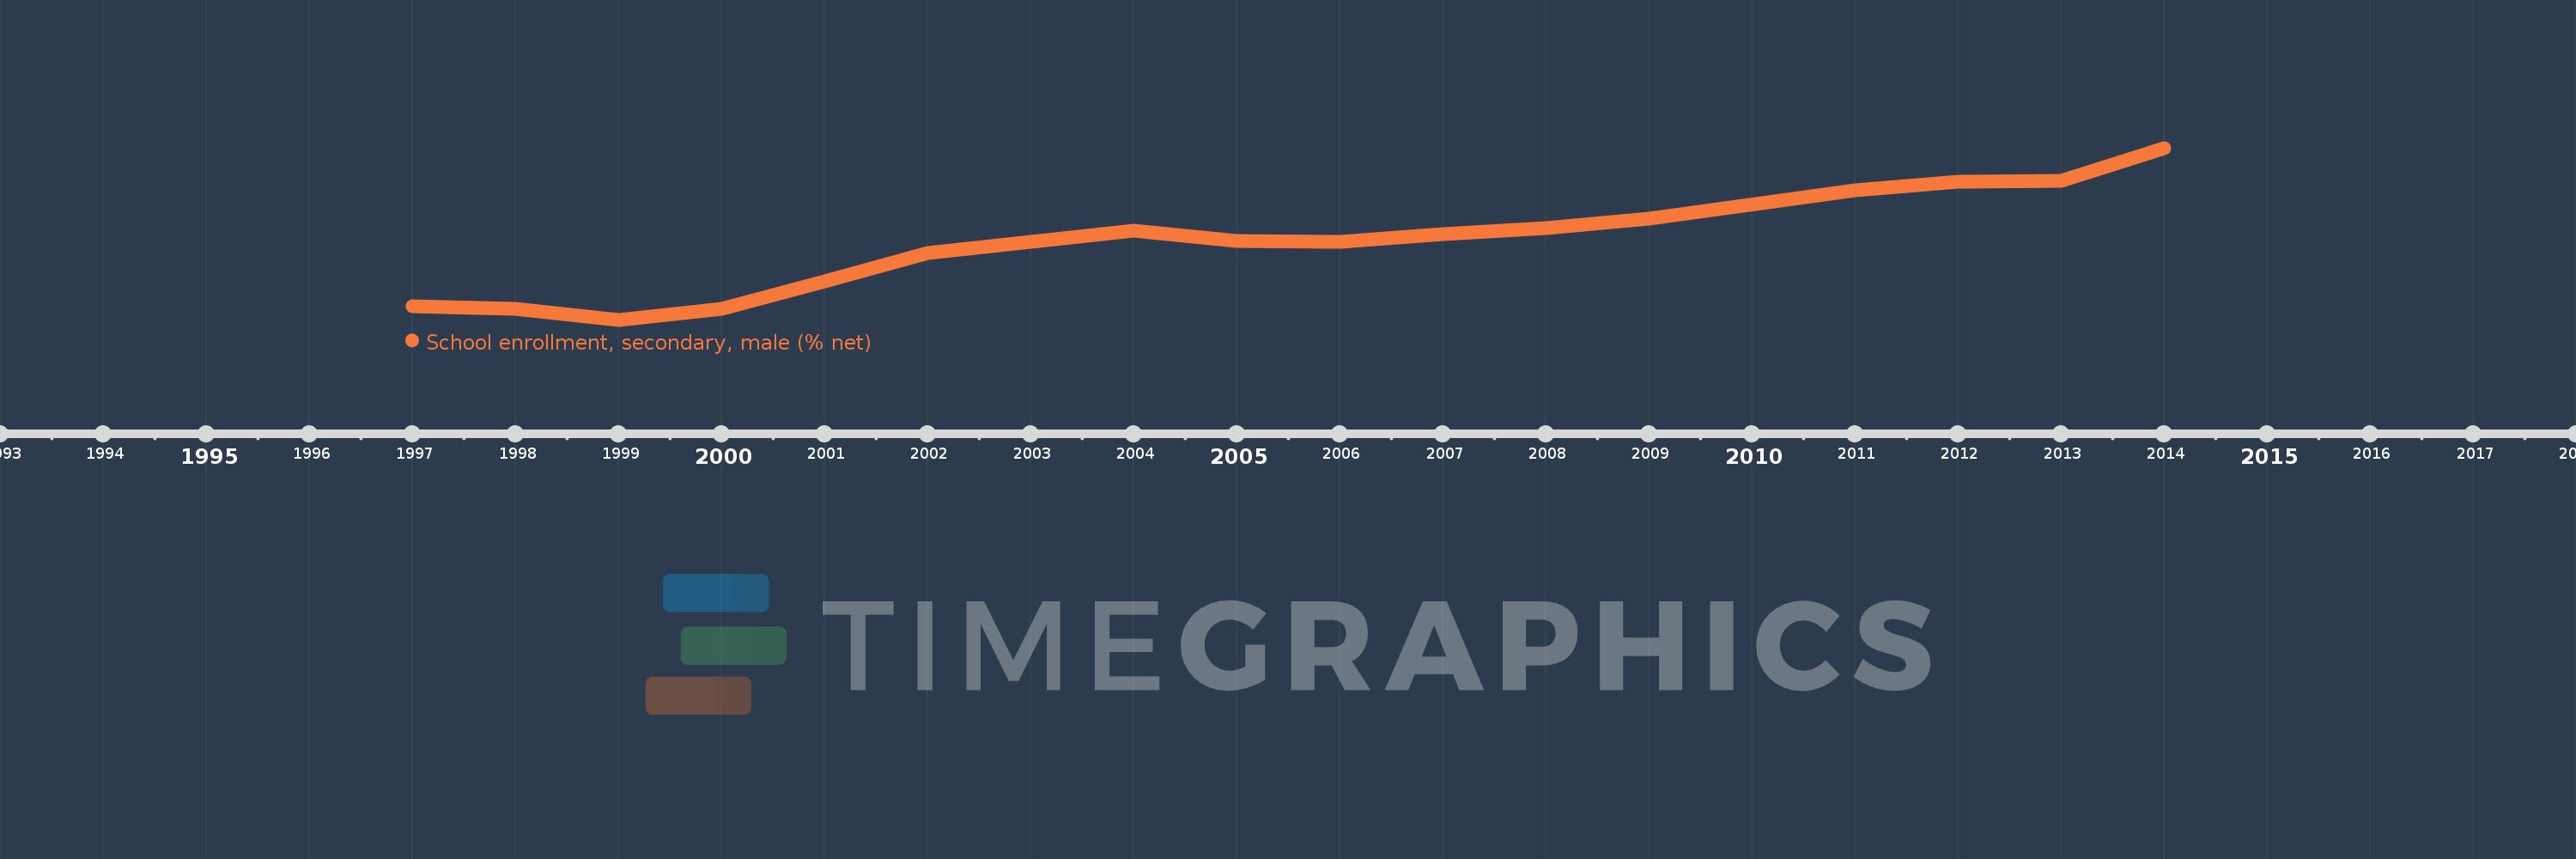
Questa scala temporale mostra un grafico dal 1997 anno al 2014 anno. Europe & Central Asia. I dati fino ad 1996 anno non disponibili. Il numero di osservazioni attuali secondo i date: 17.
La fonte (nome):
Indicatori dello sviluppo mondiale
La fonte (organizzazione):
United Nations Educational, Scientific, and Cultural Organization (UNESCO) Institute for Statistics.
Categorie:
Education, Gender
sono stati aggiornati
23 apr 2017 anni
Indicatori delle variazioni dei valori per anni
In media:
85.726
Minima:
82.491
1 gen 1999 anni
Massimo:
89.645
1 gen 2014 anni
Alla data di osservazione
Valore
Variazione assoluta
La variazione rispetto al valore precedente
1 gen 1997 anni
83.047
+83.047
0.0%
1 gen 1998 anni
82.94
-0.107
-0.13%
1 gen 1999 anni
82.491
-0.449
-0.54%
1 gen 2000 anni
82.928
+0.437
0.53%
1 gen 2001 anni
84.092
+1.164
1.4%
1 gen 2002 anni
85.253
+1.16
1.38%
1 gen 2003 anni
85.729
+0.476
0.56%
1 gen 2004 anni
86.21
+0.481
0.56%
1 gen 2005 anni
85.782
-0.428
-0.5%
1 gen 2006 anni
85.72
-0.062
-0.07%
1 gen 2007 anni
86.073
+0.353
0.41%
1 gen 2008 anni
86.322
+0.248
0.29%
1 gen 2009 anni
86.686
+0.365
0.42%
1 gen 2011 anni
87.888
+1.202
1.39%
1 gen 2012 anni
88.247
+0.359
0.41%
1 gen 2013 anni
88.287
+0.04
0.05%
1 gen 2014 anni
89.645
+1.358
1.54%
Classificazione dei paesi secondo i statistiche attuali per anni