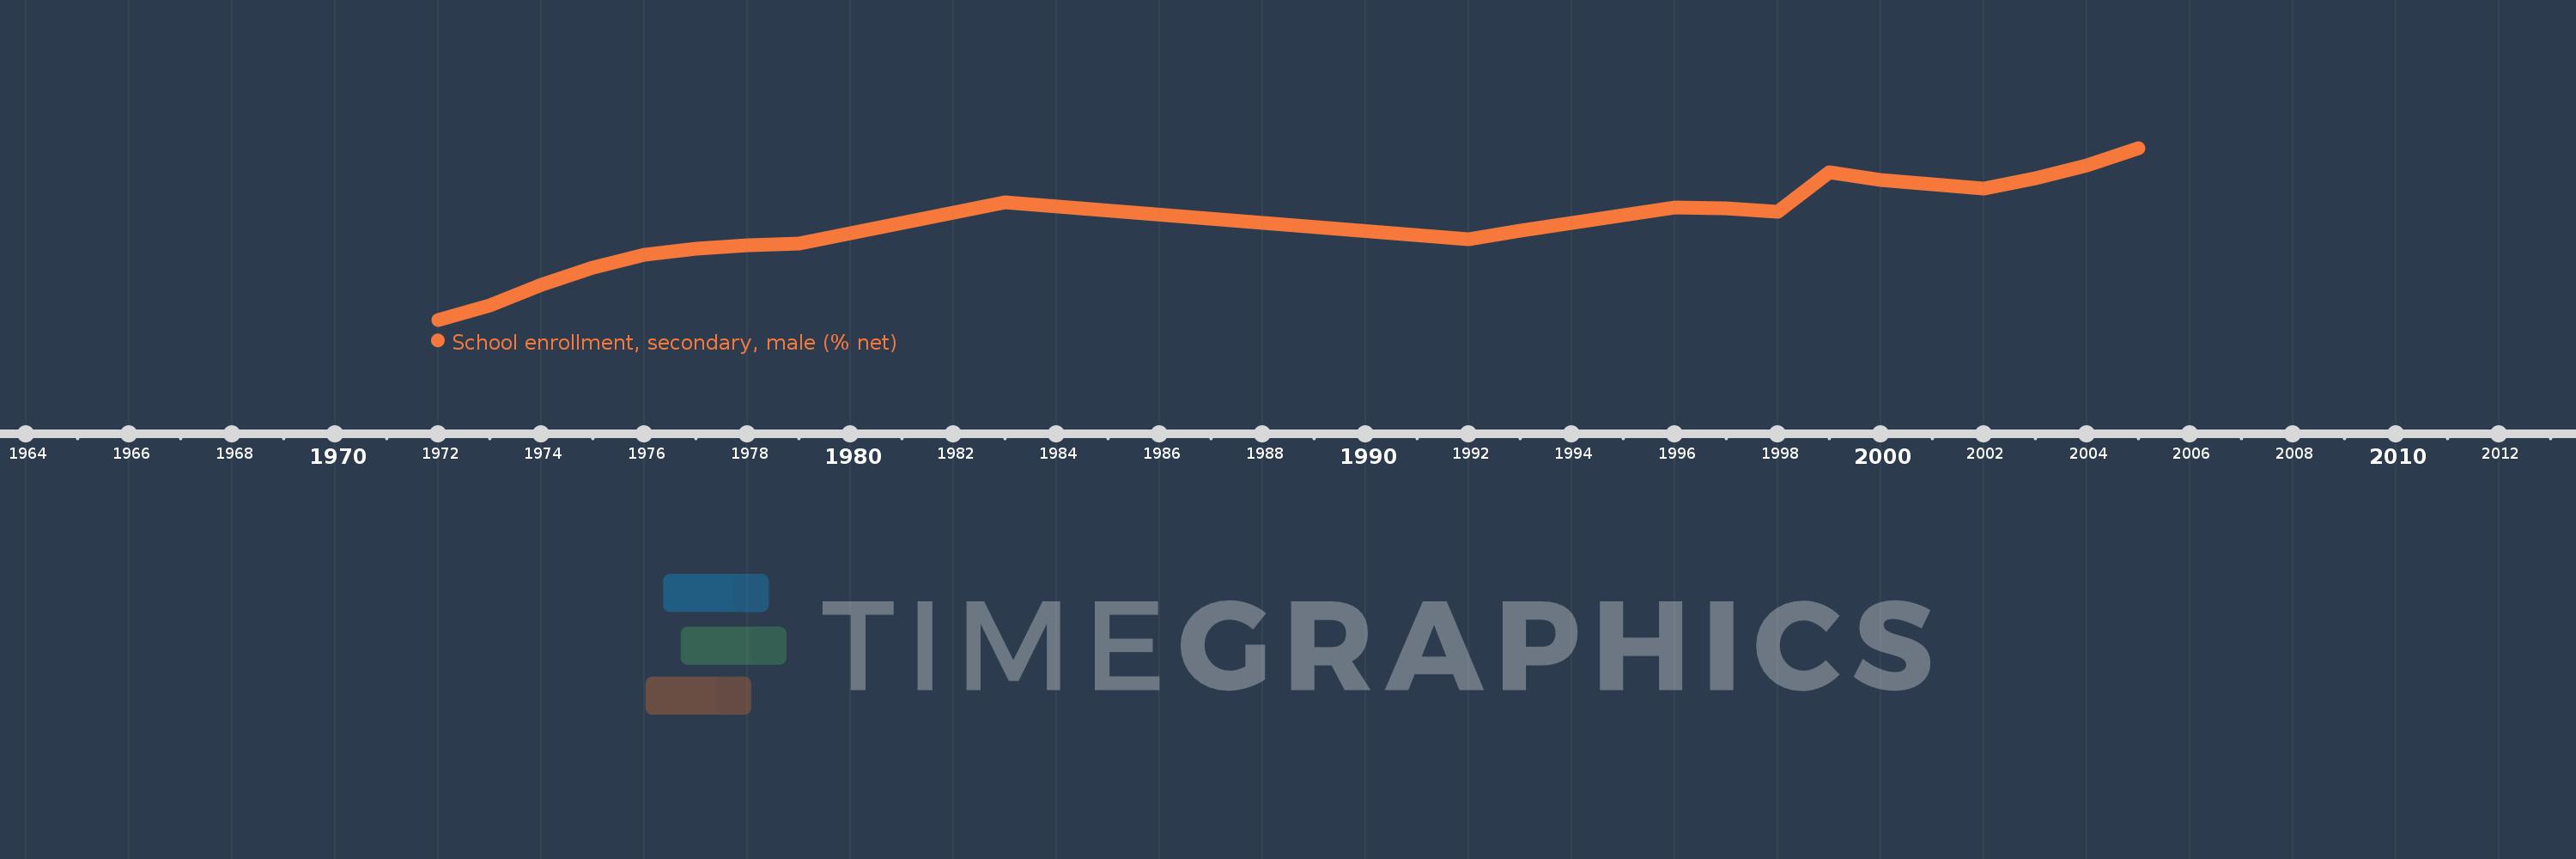
Questa scala temporale mostra un grafico dal 1972 anno al 2005 anno. Ireland. I dati fino ad 1971 anno non disponibili. Il numero di osservazioni attuali secondo i date: 21.
La fonte (nome):
Indicatori dello sviluppo mondiale
La fonte (organizzazione):
United Nations Educational, Scientific, and Cultural Organization (UNESCO) Institute for Statistics.
Categorie:
Education, Gender
sono stati aggiornati
23 apr 2017 anni
Indicatori delle variazioni dei valori per anni
In media:
76.813
Minima:
61.213
1 gen 1972 anni
Massimo:
88.949
1 gen 2005 anni
Alla data di osservazione
Valore
Variazione assoluta
La variazione rispetto al valore precedente
1 gen 1972 anni
61.213
+61.213
0.0%
1 gen 1973 anni
63.547
+2.334
3.81%
1 gen 1974 anni
66.825
+3.278
5.16%
1 gen 1975 anni
69.686
+2.861
4.28%
1 gen 1976 anni
71.678
+1.992
2.86%
1 gen 1977 anni
72.707
+1.029
1.44%
1 gen 1978 anni
73.288
+0.58
0.8%
1 gen 1979 anni
73.58
+0.292
0.4%
1 gen 1983 anni
80.21
+6.63
9.01%
1 gen 1992 anni
74.14
-6.07
-7.57%
1 gen 1993 anni
75.63
+1.491
2.01%
1 gen 1996 anni
79.372
+3.742
4.95%
1 gen 1997 anni
79.188
-0.185
-0.23%
1 gen 1998 anni
78.602
-0.585
-0.74%
1 gen 1999 anni
85.022
+6.42
8.17%
1 gen 2000 anni
83.788
-1.234
-1.45%
1 gen 2001 anni
83.074
-0.714
-0.85%
1 gen 2002 anni
82.399
-0.676
-0.81%
1 gen 2003 anni
84.078
+1.679
2.04%
1 gen 2004 anni
86.102
+2.024
2.41%
1 gen 2005 anni
88.949
+2.847
3.31%
Classificazione dei paesi secondo i statistiche attuali per anni