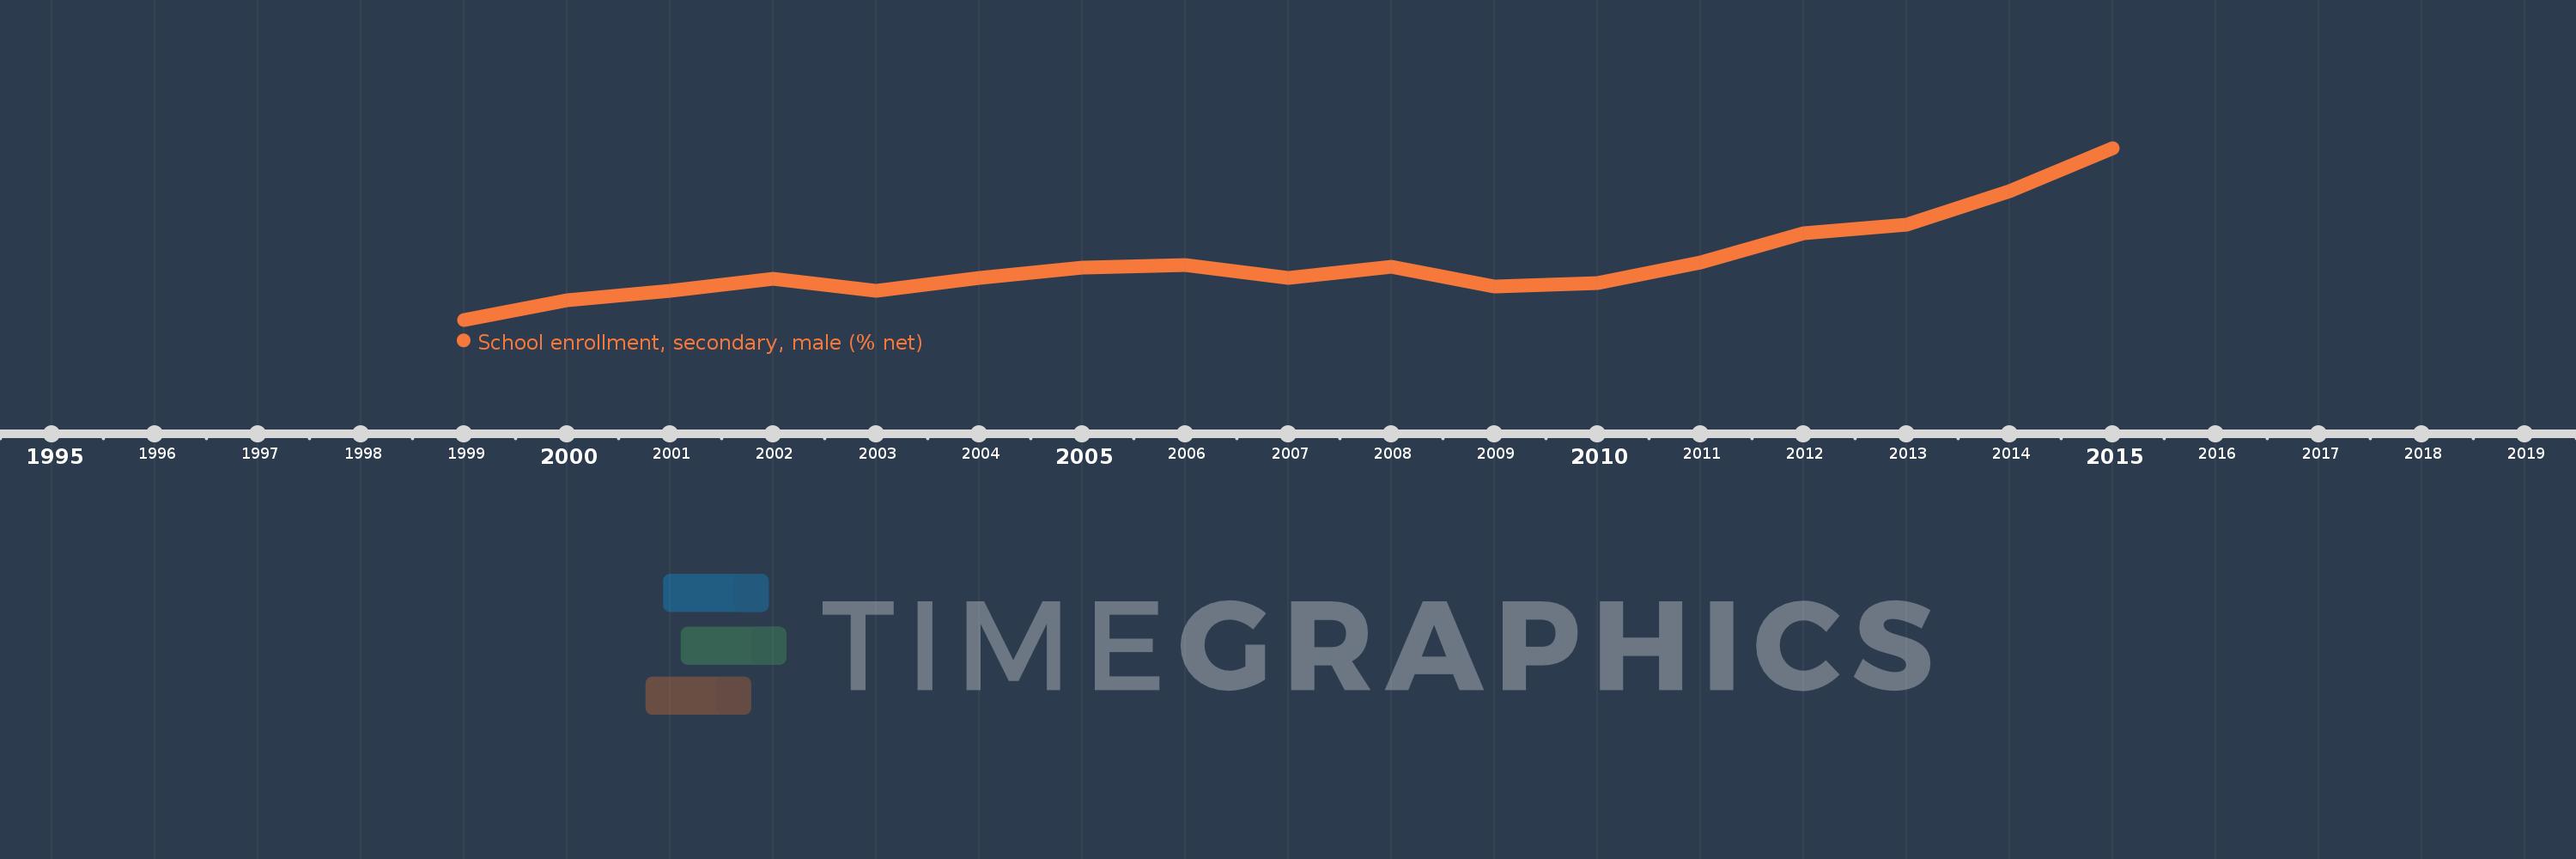
Questa scala temporale mostra un grafico dal 1999 anno al 2015 anno. East Asia & Pacific. I dati fino ad 1998 anno non disponibili. Il numero di osservazioni attuali secondo i date: 17.
La fonte (nome):
Indicatori dello sviluppo mondiale
La fonte (organizzazione):
United Nations Educational, Scientific, and Cultural Organization (UNESCO) Institute for Statistics.
Categorie:
Education, Gender
sono stati aggiornati
23 apr 2017 anni
Indicatori delle variazioni dei valori per anni
In media:
69.337
Minima:
66.214
1 gen 1999 anni
Massimo:
75.613
1 gen 2015 anni
Alla data di osservazione
Valore
Variazione assoluta
La variazione rispetto al valore precedente
1 gen 1999 anni
66.214
+66.214
0.0%
1 gen 2000 anni
67.279
+1.066
1.61%
1 gen 2001 anni
67.802
+0.522
0.78%
1 gen 2002 anni
68.446
+0.644
0.95%
1 gen 2003 anni
67.806
-0.64
-0.94%
1 gen 2004 anni
68.502
+0.696
1.03%
1 gen 2005 anni
69.077
+0.575
0.84%
1 gen 2006 anni
69.191
+0.114
0.16%
1 gen 2007 anni
68.525
-0.666
-0.96%
1 gen 2008 anni
69.121
+0.596
0.87%
1 gen 2009 anni
68.01
-1.111
-1.61%
1 gen 2010 anni
68.231
+0.222
0.33%
1 gen 2011 anni
69.326
+1.095
1.61%
1 gen 2012 anni
70.943
+1.617
2.33%
1 gen 2013 anni
71.398
+0.454
0.64%
1 gen 2014 anni
73.253
+1.855
2.6%
1 gen 2015 anni
75.613
+2.36
3.22%
Classificazione dei paesi secondo i statistiche attuali per anni