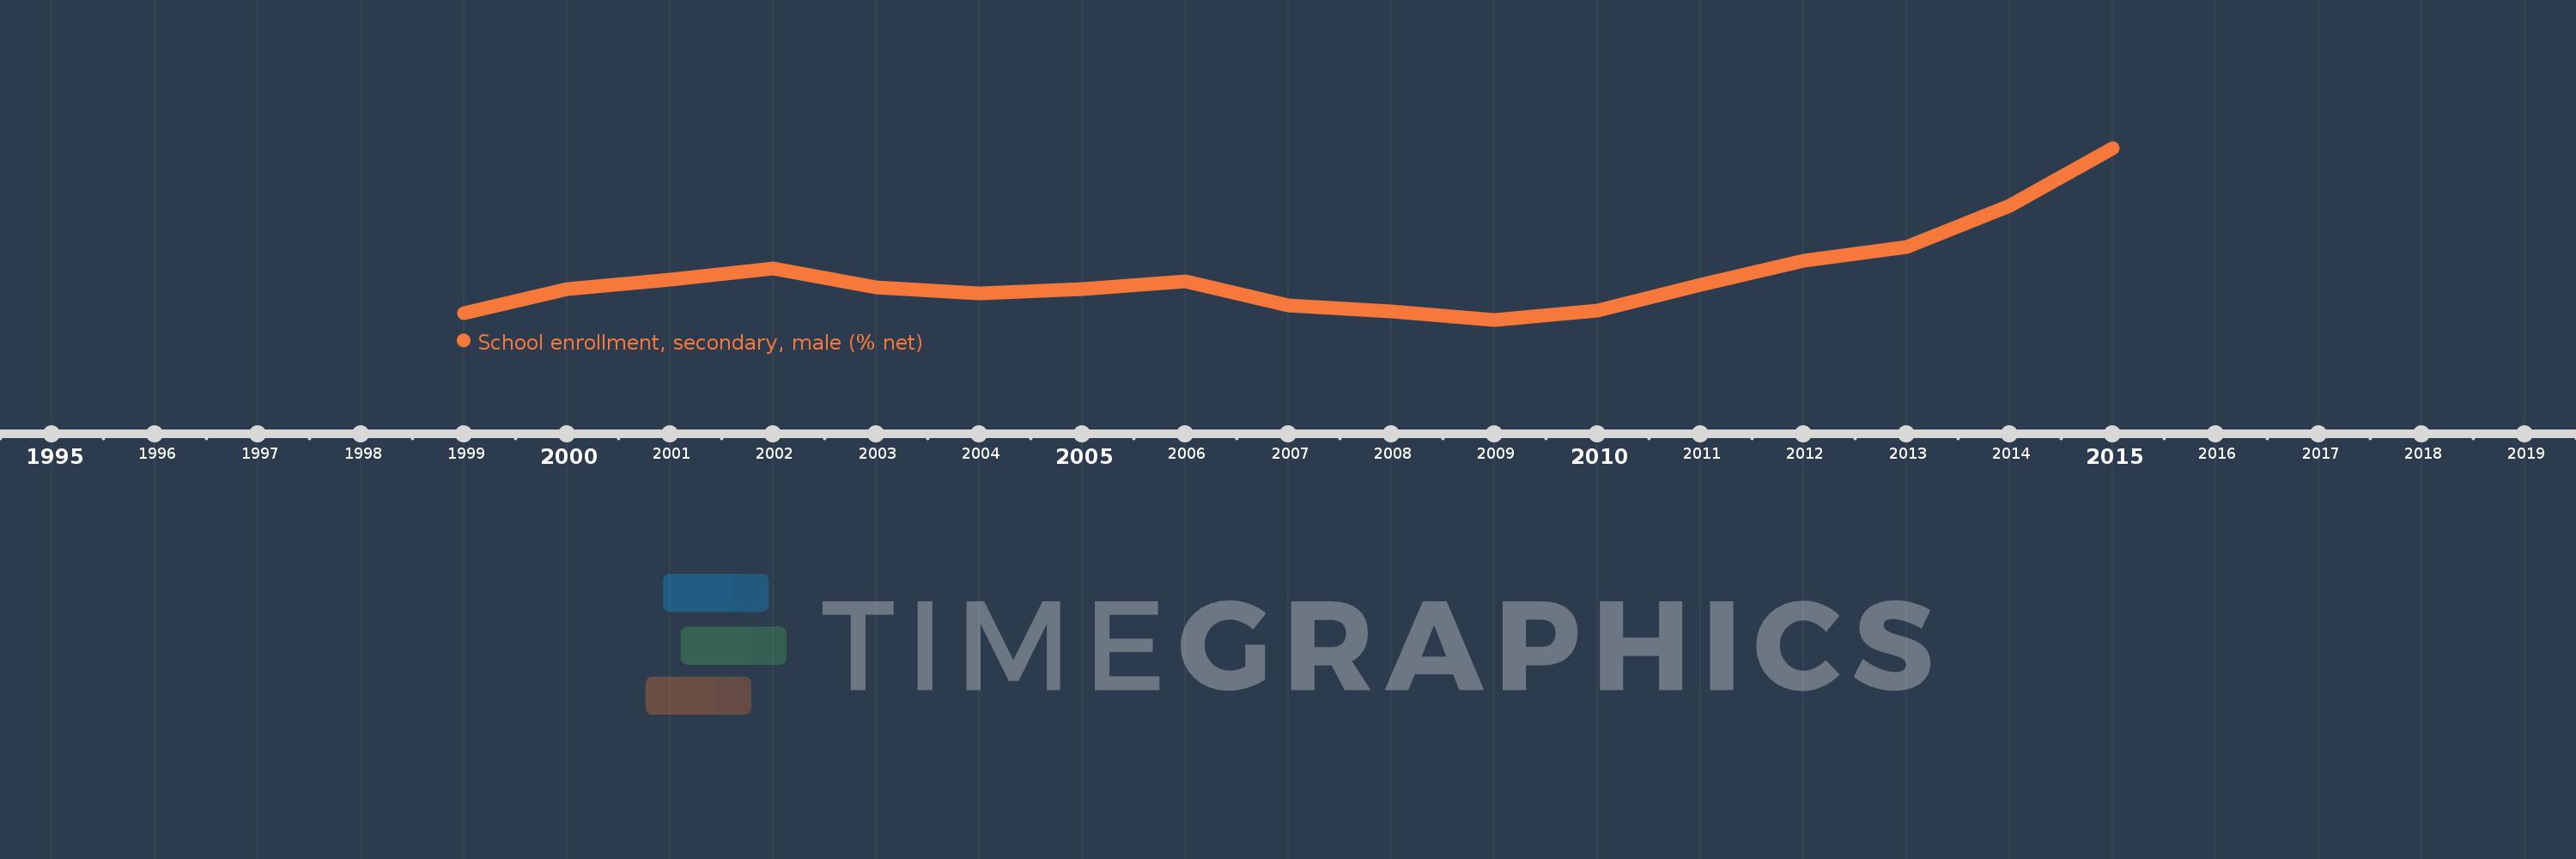
Questa scala temporale mostra un grafico dal 1999 anno al 2015 anno. Late-demographic dividend. I dati fino ad 1998 anno non disponibili. Il numero di osservazioni attuali secondo i date: 17.
La fonte (nome):
Indicatori dello sviluppo mondiale
La fonte (organizzazione):
United Nations Educational, Scientific, and Cultural Organization (UNESCO) Institute for Statistics.
Categorie:
Education, Gender
sono stati aggiornati
23 apr 2017 anni
Indicatori delle variazioni dei valori per anni
In media:
72.781
Minima:
70.851
1 gen 2009 anni
Massimo:
78.442
1 gen 2015 anni
Alla data di osservazione
Valore
Variazione assoluta
La variazione rispetto al valore precedente
1 gen 1999 anni
71.149
+71.149
0.0%
1 gen 2000 anni
72.211
+1.062
1.49%
1 gen 2001 anni
72.64
+0.429
0.59%
1 gen 2002 anni
73.13
+0.49
0.67%
1 gen 2003 anni
72.273
-0.857
-1.17%
1 gen 2004 anni
72.032
-0.24
-0.33%
1 gen 2005 anni
72.201
+0.169
0.23%
1 gen 2006 anni
72.531
+0.33
0.46%
1 gen 2007 anni
71.486
-1.045
-1.44%
1 gen 2008 anni
71.236
-0.25
-0.35%
1 gen 2009 anni
70.851
-0.385
-0.54%
1 gen 2010 anni
71.27
+0.42
0.59%
1 gen 2011 anni
72.386
+1.115
1.56%
1 gen 2012 anni
73.474
+1.088
1.5%
1 gen 2013 anni
74.081
+0.607
0.83%
1 gen 2014 anni
75.893
+1.812
2.45%
1 gen 2015 anni
78.442
+2.549
3.36%
Classificazione dei paesi secondo i statistiche attuali per anni