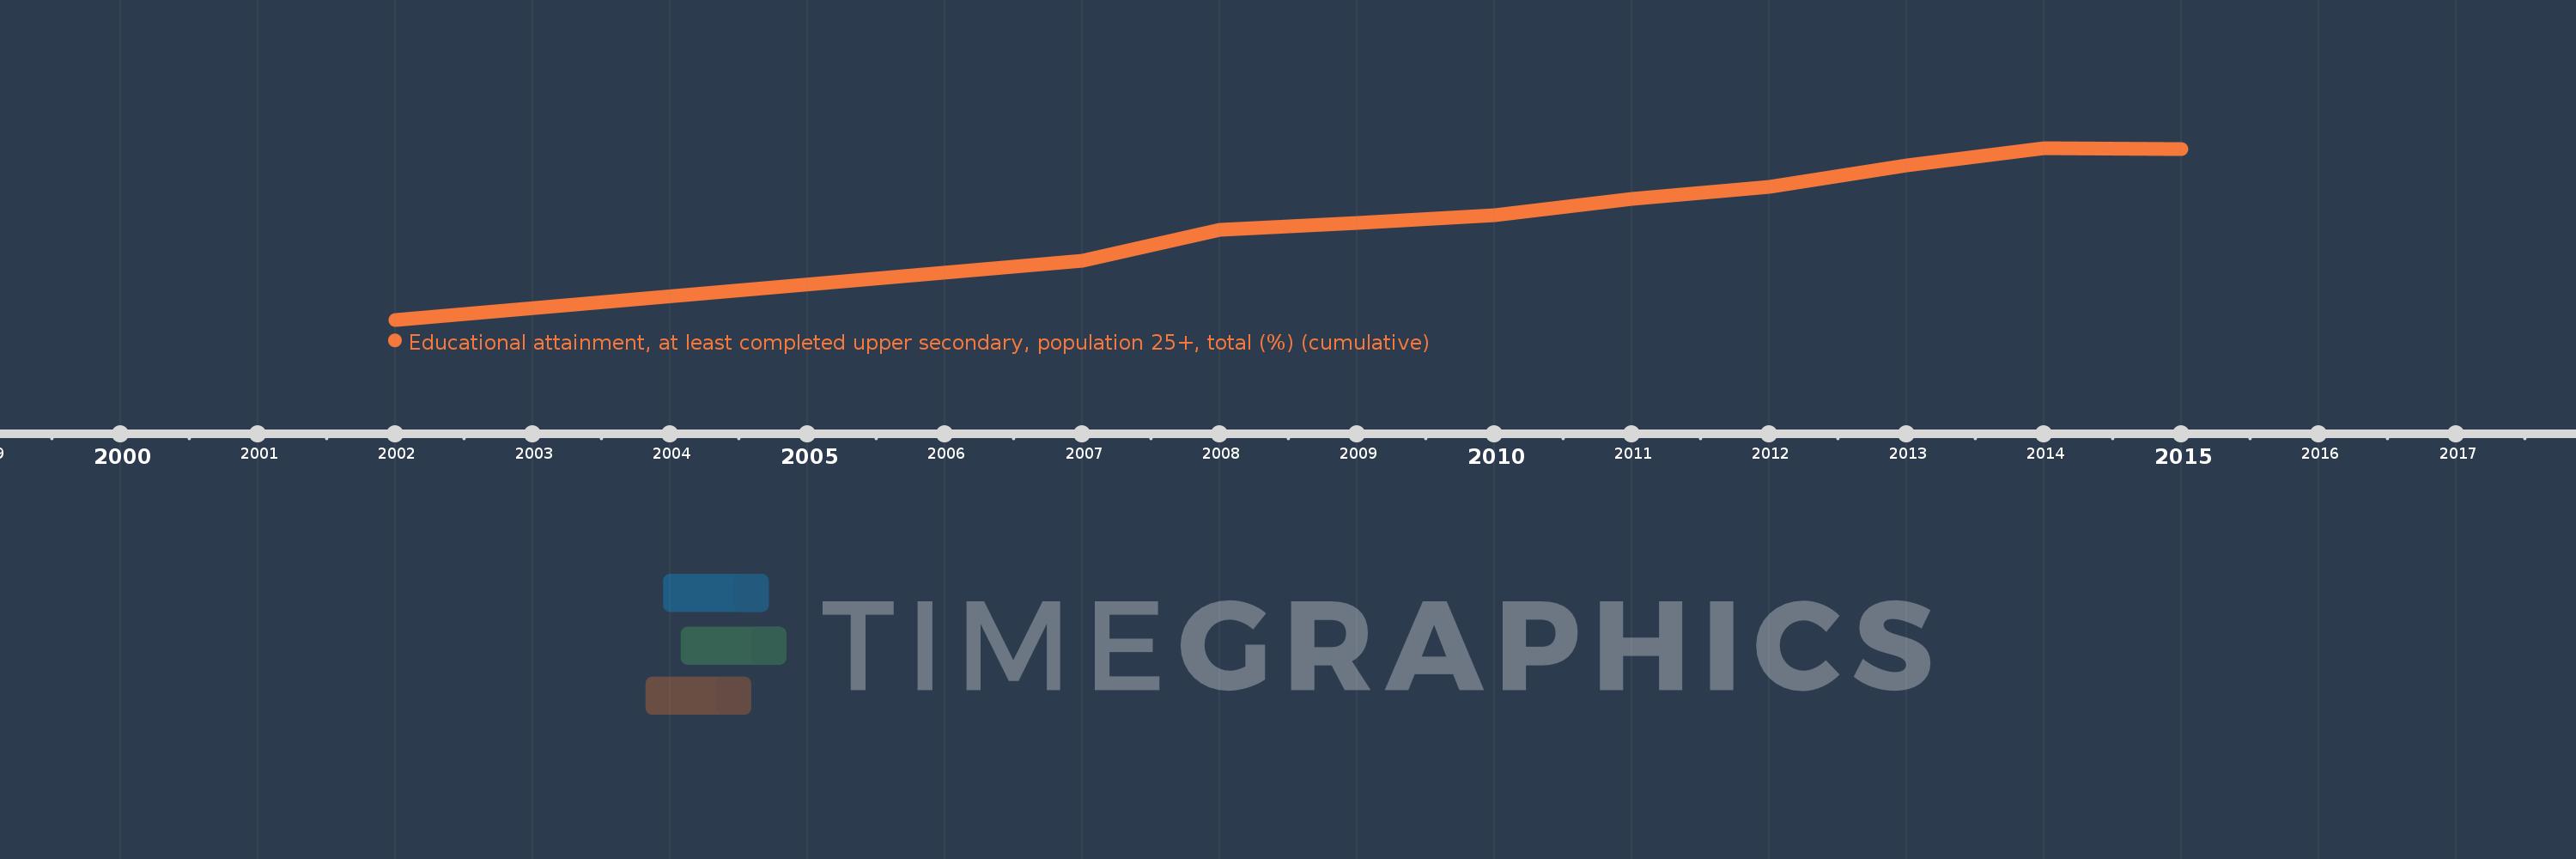
Questa scala temporale mostra un grafico dal 2002 anno al 2015 anno. Bulgaria. I dati fino ad 2001 anno non disponibili. Il numero di osservazioni attuali secondo i date: 10.
La fonte (nome):
Indicatori dello sviluppo mondiale
La fonte (organizzazione):
United Nations Educational, Scientific, and Cultural Organization (UNESCO) Institute for Statistics.
Categorie:
Education, Gender
sono stati aggiornati
23 apr 2017 anni
Indicatori delle variazioni dei valori per anni
In media:
68.73
Minima:
59.462
1 gen 2002 anni
Massimo:
73.938
1 gen 2014 anni
Alla data di osservazione
Valore
Variazione assoluta
La variazione rispetto al valore precedente
1 gen 2002 anni
59.462
+59.462
0.0%
1 gen 2007 anni
64.449
+4.987
8.39%
1 gen 2008 anni
67.021
+2.572
3.99%
1 gen 2009 anni
67.612
+0.592
0.88%
1 gen 2010 anni
68.26
+0.647
0.96%
1 gen 2011 anni
69.615
+1.355
1.99%
1 gen 2012 anni
70.653
+1.038
1.49%
1 gen 2013 anni
72.481
+1.828
2.59%
1 gen 2014 anni
73.938
+1.457
2.01%
1 gen 2015 anni
73.813
-0.125
-0.17%
Classificazione dei paesi secondo i statistiche attuali per anni