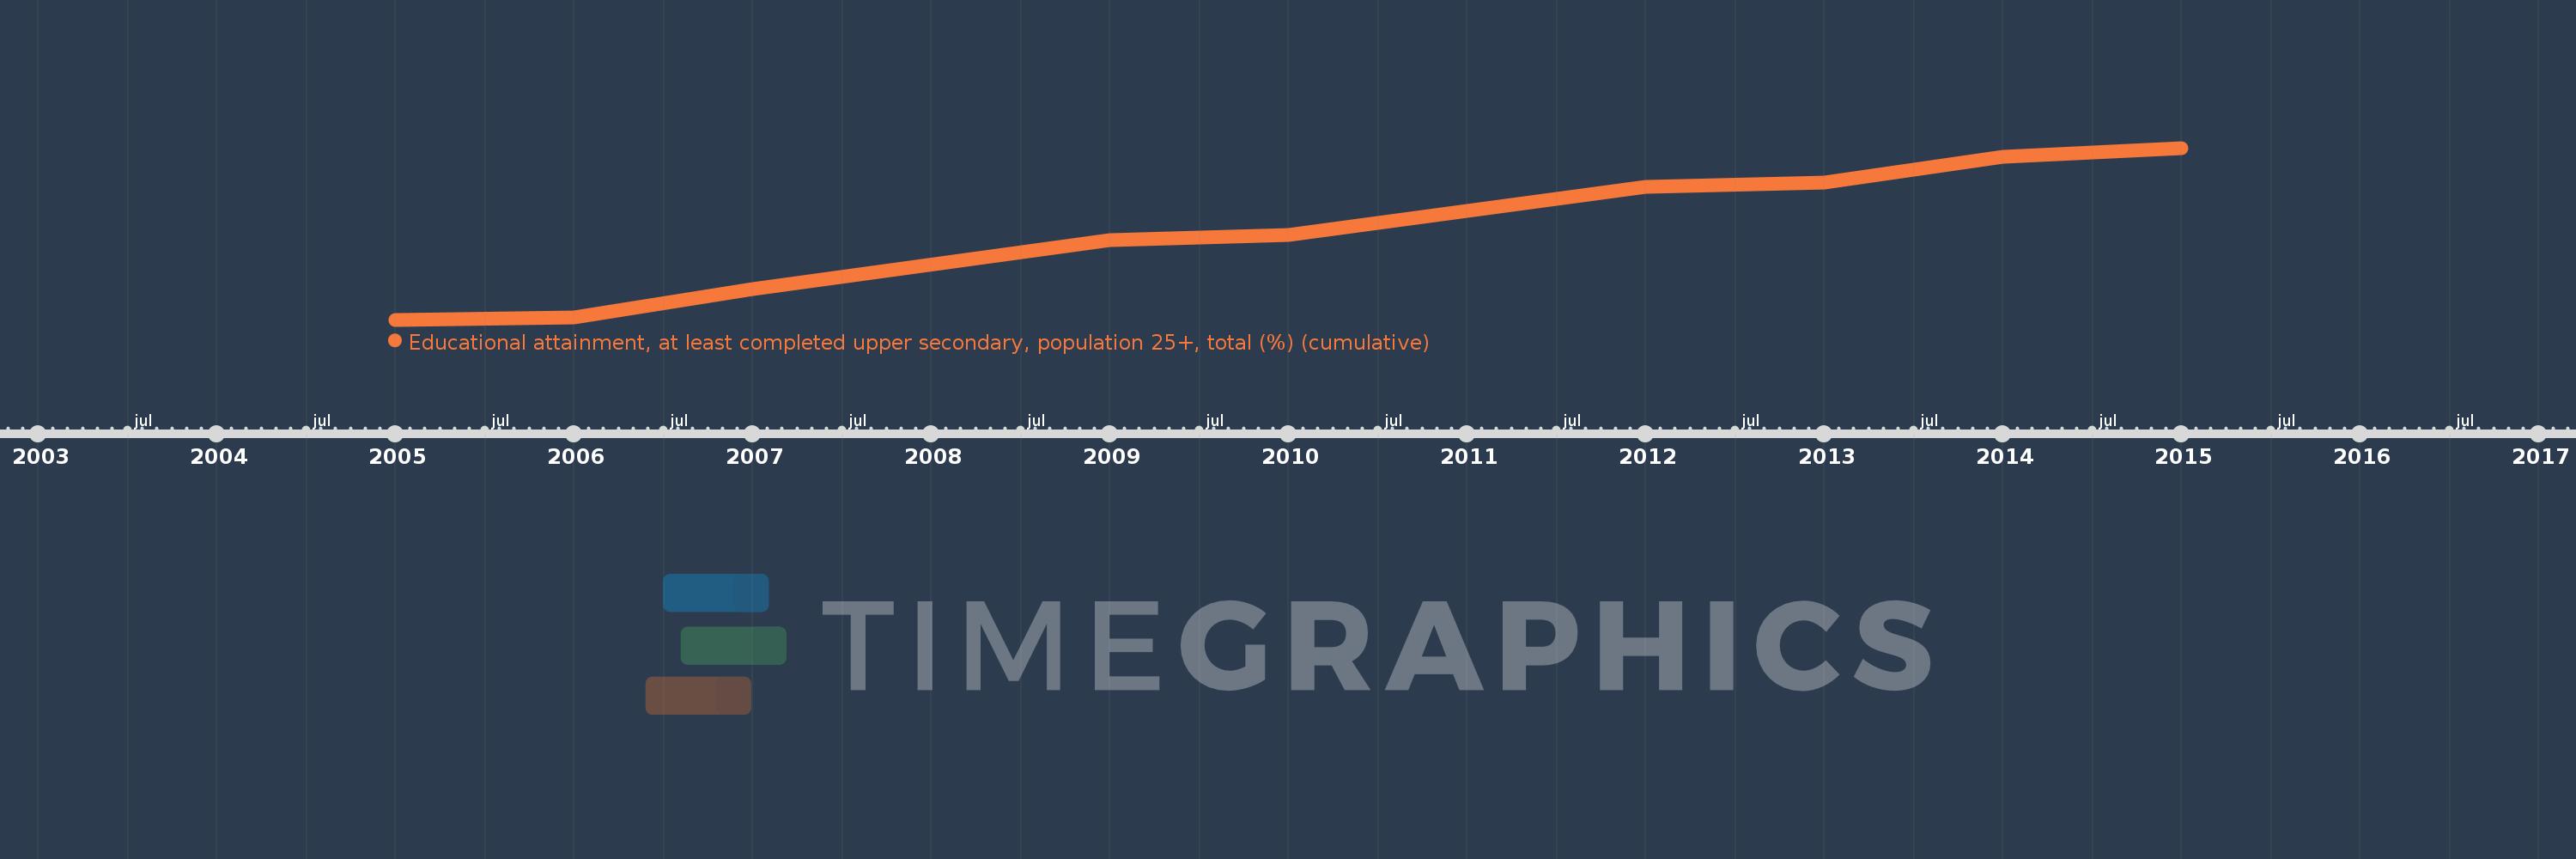
Questa scala temporale mostra un grafico dal 2005 anno al 2015 anno. United States. I dati fino ad 2004 anno non disponibili. Il numero di osservazioni attuali secondo i date: 10.
La fonte (nome):
Indicatori dello sviluppo mondiale
La fonte (organizzazione):
United Nations Educational, Scientific, and Cultural Organization (UNESCO) Institute for Statistics.
Categorie:
Education, Gender
sono stati aggiornati
23 apr 2017 anni
Indicatori delle variazioni dei valori per anni
In media:
86.827
Minima:
85.153
1 gen 2005 anni
Massimo:
88.314
1 gen 2015 anni
Alla data di osservazione
Valore
Variazione assoluta
La variazione rispetto al valore precedente
1 gen 2005 anni
85.153
+85.153
0.0%
1 gen 2006 anni
85.192
+0.039
0.05%
1 gen 2007 anni
85.723
+0.531
0.62%
1 gen 2009 anni
86.614
+0.891
1.04%
1 gen 2010 anni
86.709
+0.095
0.11%
1 gen 2011 anni
87.149
+0.44
0.51%
1 gen 2012 anni
87.591
+0.441
0.51%
1 gen 2013 anni
87.679
+0.088
0.1%
1 gen 2014 anni
88.15
+0.471
0.54%
1 gen 2015 anni
88.314
+0.163
0.19%
Classificazione dei paesi secondo i statistiche attuali per anni