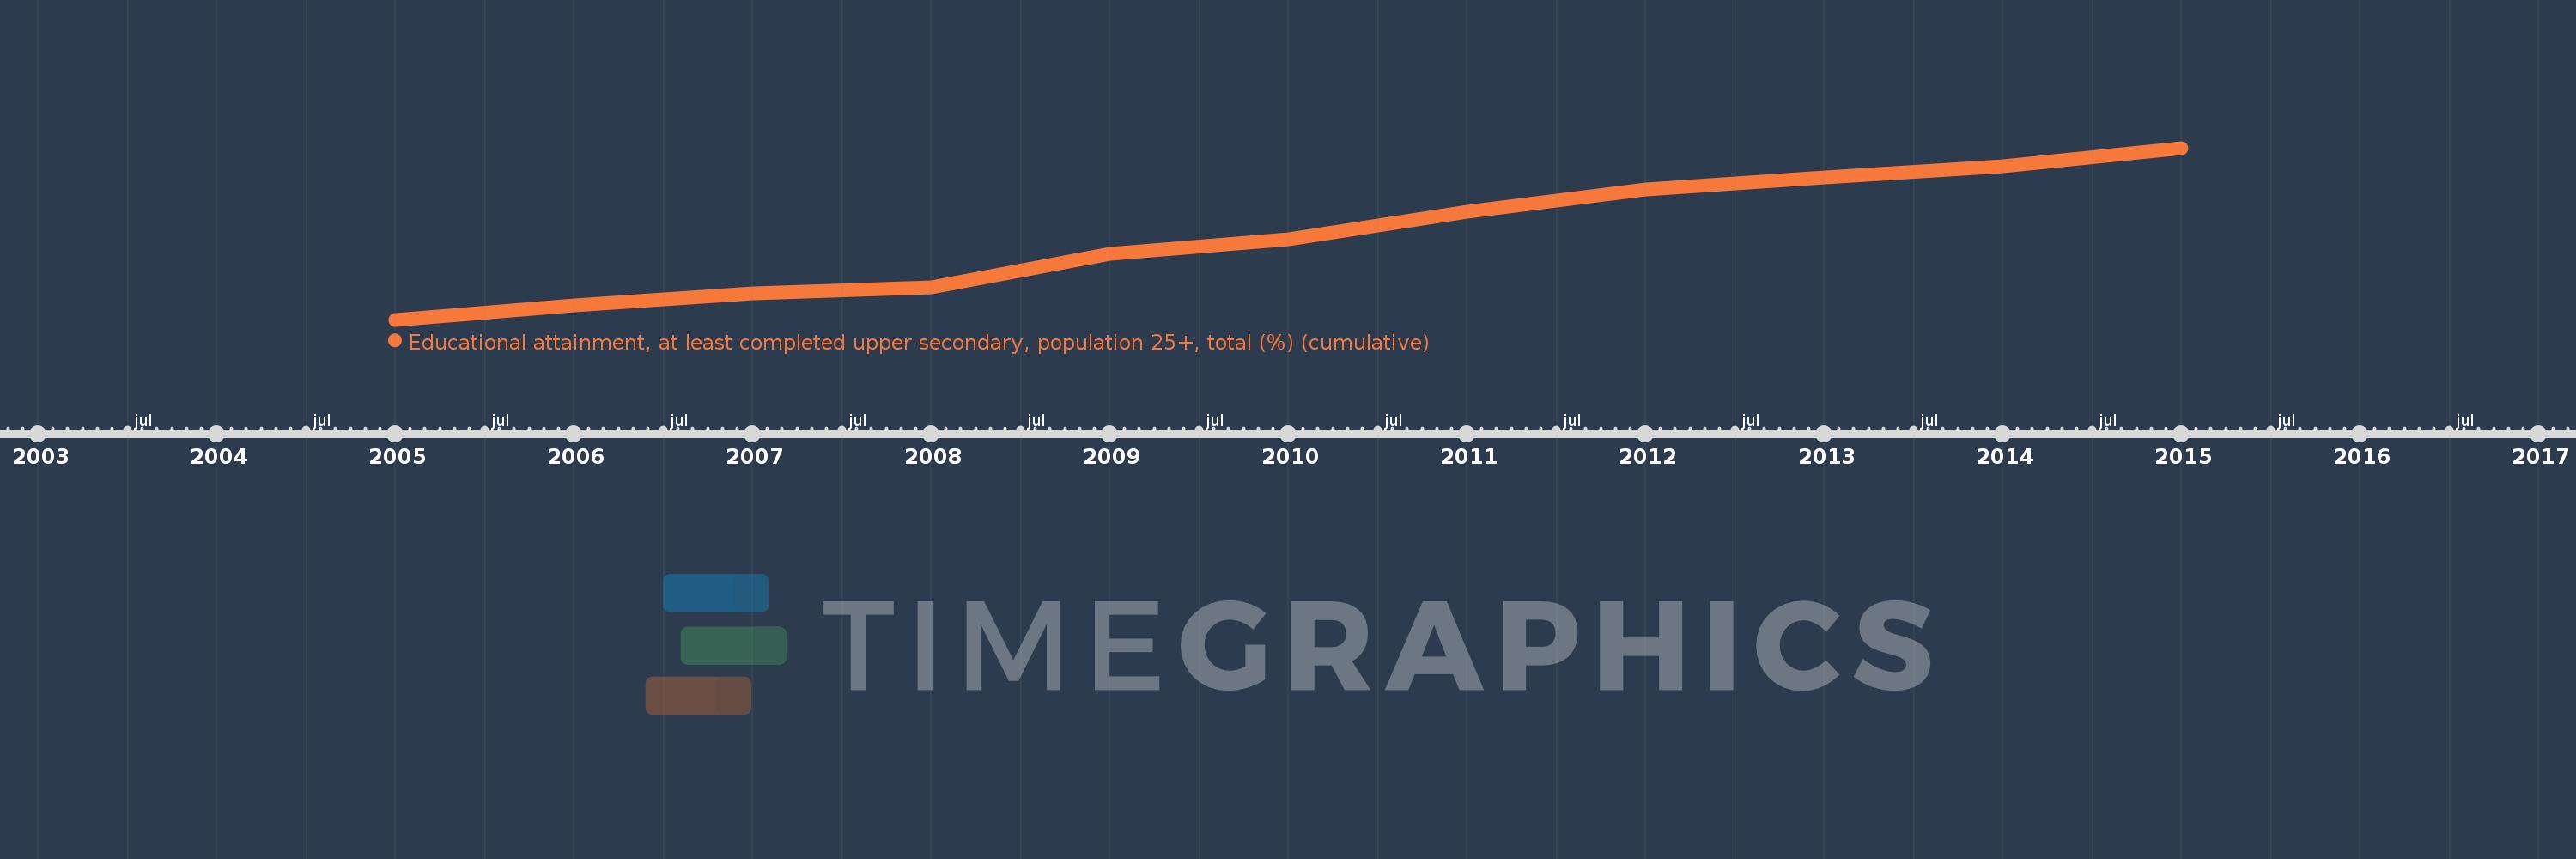
Questa scala temporale mostra un grafico dal 2005 anno al 2015 anno. Turkey. I dati fino ad 2004 anno non disponibili. Il numero di osservazioni attuali secondo i date: 11.
La fonte (nome):
Indicatori dello sviluppo mondiale
La fonte (organizzazione):
United Nations Educational, Scientific, and Cultural Organization (UNESCO) Institute for Statistics.
Categorie:
Education, Gender
sono stati aggiornati
23 apr 2017 anni
Indicatori delle variazioni dei valori per anni
In media:
27.986
Minima:
21.027
1 gen 2005 anni
Massimo:
35.237
1 gen 2015 anni
Alla data di osservazione
Valore
Variazione assoluta
La variazione rispetto al valore precedente
1 gen 2005 anni
21.027
+21.027
0.0%
1 gen 2006 anni
22.19
+1.163
5.53%
1 gen 2007 anni
23.201
+1.011
4.55%
1 gen 2008 anni
23.686
+0.485
2.09%
1 gen 2009 anni
26.493
+2.807
11.85%
1 gen 2010 anni
27.703
+1.21
4.57%
1 gen 2011 anni
29.986
+2.284
8.24%
1 gen 2012 anni
31.799
+1.812
6.04%
1 gen 2013 anni
32.766
+0.968
3.04%
1 gen 2014 anni
33.759
+0.992
3.03%
1 gen 2015 anni
35.237
+1.479
4.38%
Classificazione dei paesi secondo i statistiche attuali per anni