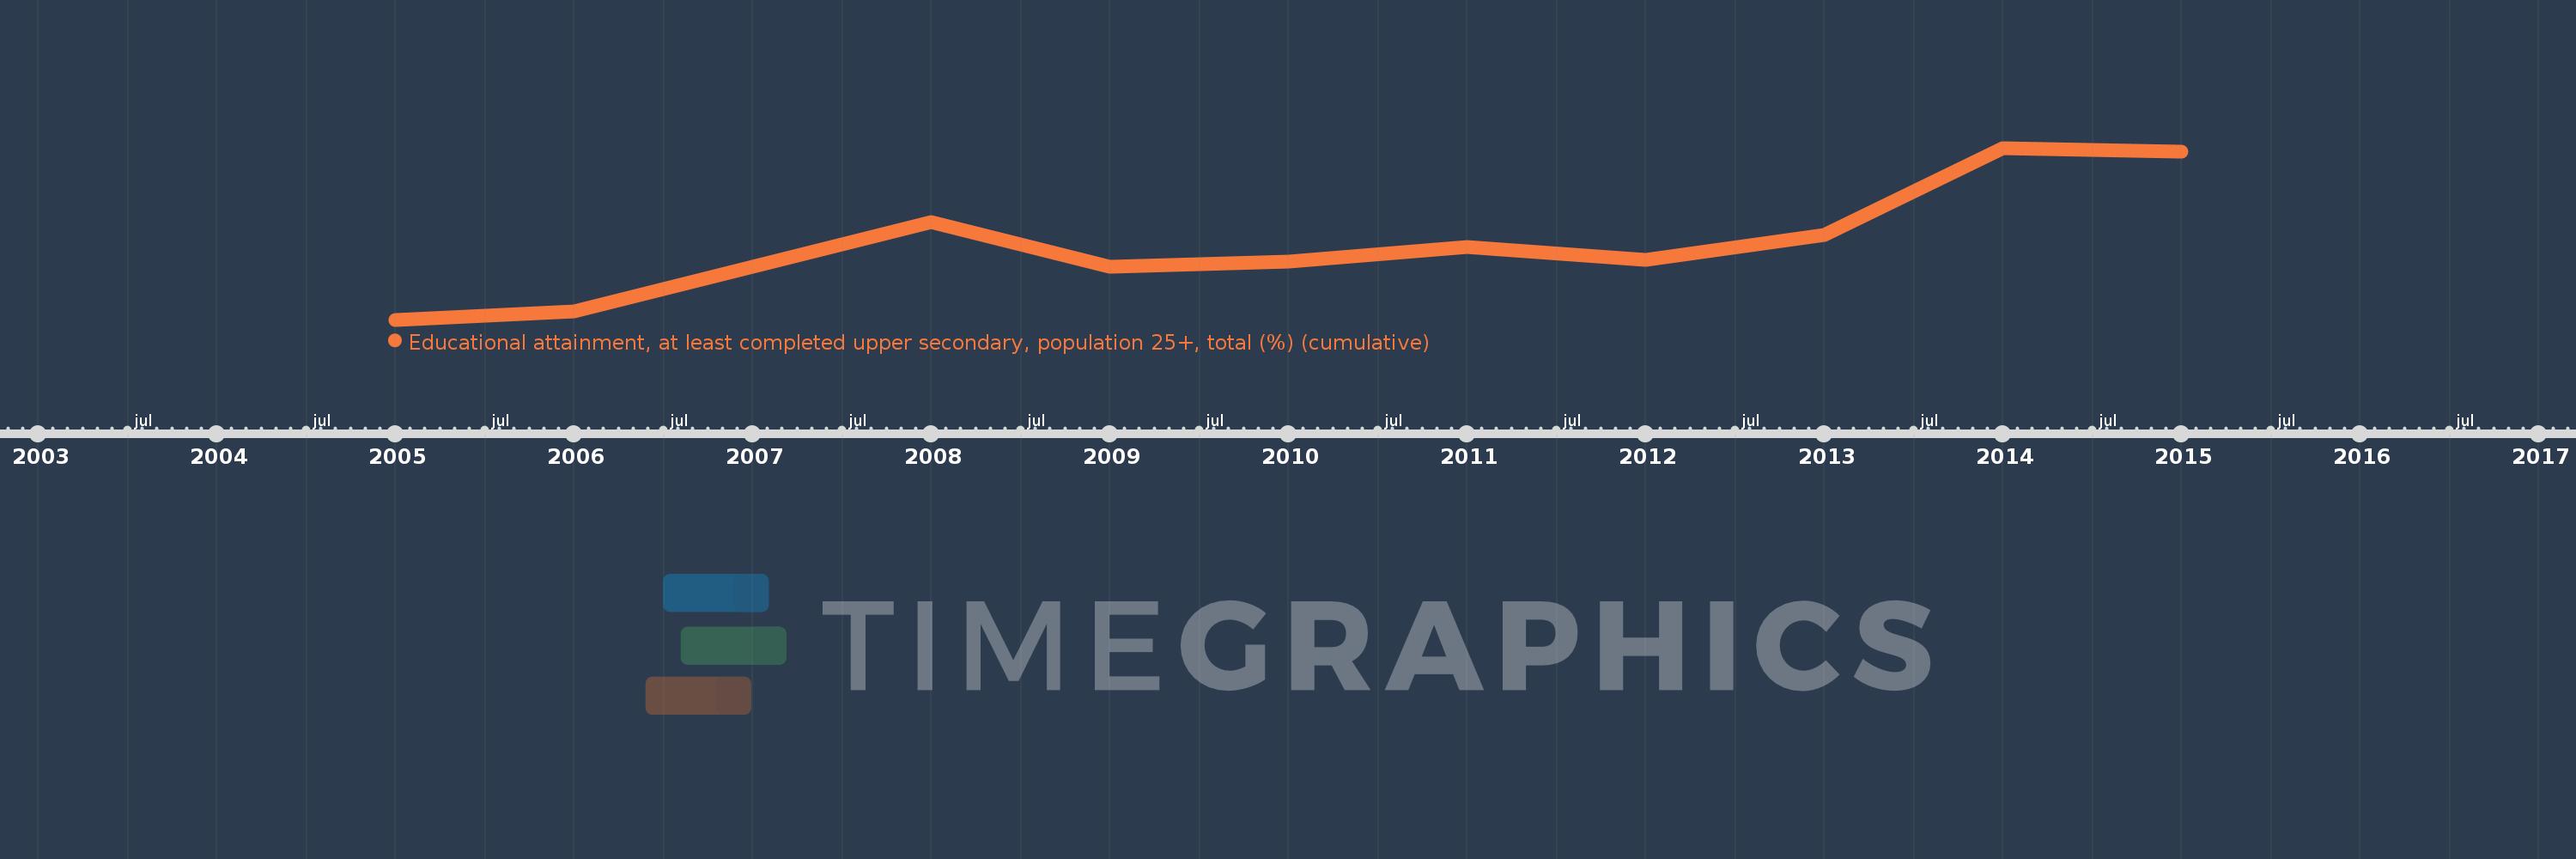
Questa scala temporale mostra un grafico dal 2005 anno al 2015 anno. Netherlands. I dati fino ad 2004 anno non disponibili. Il numero di osservazioni attuali secondo i date: 10.
La fonte (nome):
Indicatori dello sviluppo mondiale
La fonte (organizzazione):
United Nations Educational, Scientific, and Cultural Organization (UNESCO) Institute for Statistics.
Categorie:
Education, Gender
sono stati aggiornati
23 apr 2017 anni
Indicatori delle variazioni dei valori per anni
In media:
66.893
Minima:
64.728
1 gen 2005 anni
Massimo:
69.53
1 gen 2014 anni
Alla data di osservazione
Valore
Variazione assoluta
La variazione rispetto al valore precedente
1 gen 2005 anni
64.728
+64.728
0.0%
1 gen 2006 anni
64.954
+0.226
0.35%
1 gen 2008 anni
67.449
+2.494
3.84%
1 gen 2009 anni
66.221
-1.228
-1.82%
1 gen 2010 anni
66.345
+0.123
0.19%
1 gen 2011 anni
66.772
+0.428
0.64%
1 gen 2012 anni
66.41
-0.363
-0.54%
1 gen 2013 anni
67.099
+0.689
1.04%
1 gen 2014 anni
69.53
+2.431
3.62%
1 gen 2015 anni
69.422
-0.107
-0.15%
Classificazione dei paesi secondo i statistiche attuali per anni