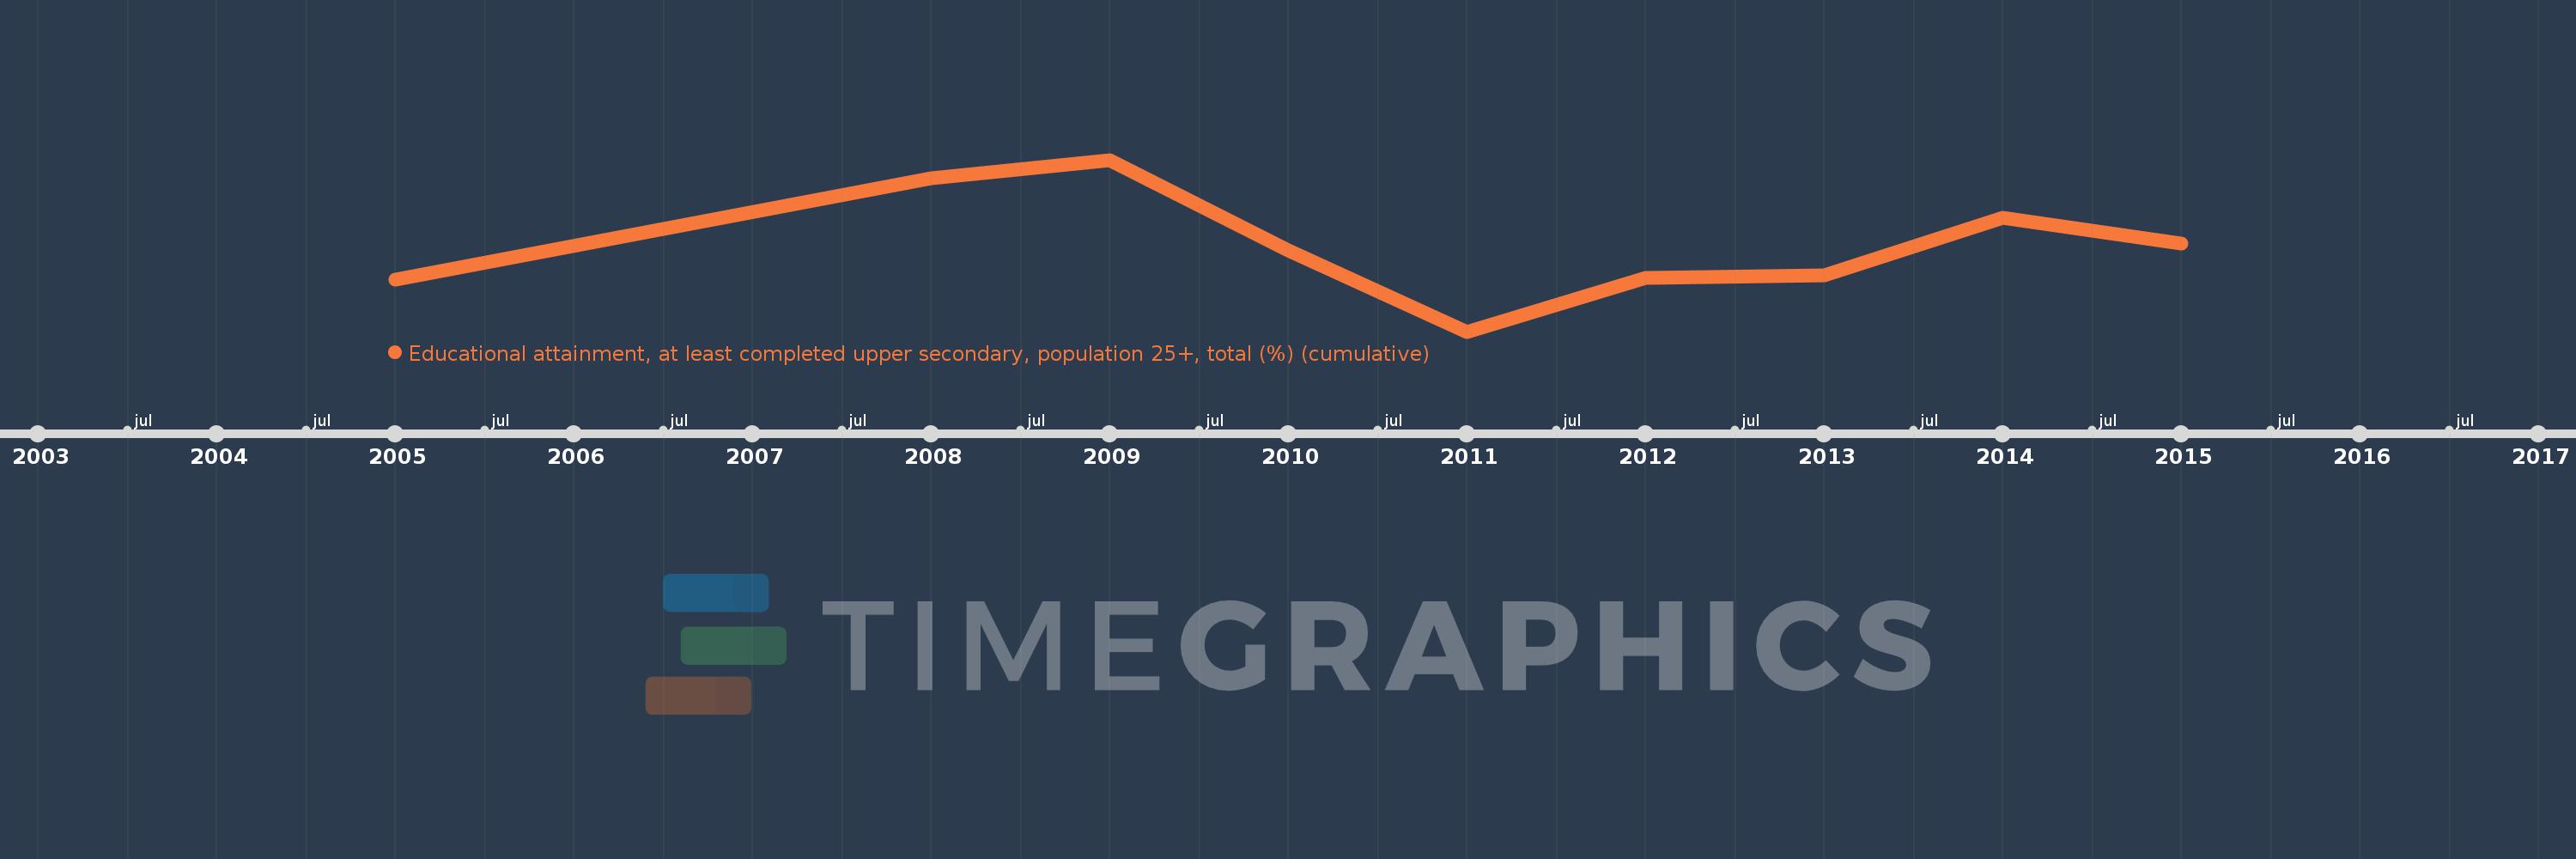
Questa scala temporale mostra un grafico dal 2005 anno al 2015 anno. Qatar. I dati fino ad 2004 anno non disponibili. Il numero di osservazioni attuali secondo i date: 9.
La fonte (nome):
Indicatori dello sviluppo mondiale
La fonte (organizzazione):
United Nations Educational, Scientific, and Cultural Organization (UNESCO) Institute for Statistics.
Categorie:
Education, Gender
sono stati aggiornati
23 apr 2017 anni
Indicatori delle variazioni dei valori per anni
In media:
43.746
Minima:
36.738
1 gen 2011 anni
Massimo:
50.829
1 gen 2009 anni
Alla data di osservazione
Valore
Variazione assoluta
La variazione rispetto al valore precedente
1 gen 2005 anni
40.972
+40.972
0.0%
1 gen 2008 anni
49.303
+8.332
20.34%
1 gen 2009 anni
50.829
+1.526
3.09%
1 gen 2010 anni
43.392
-7.437
-14.63%
1 gen 2011 anni
36.738
-6.654
-15.34%
1 gen 2012 anni
41.11
+4.372
11.9%
1 gen 2013 anni
41.344
+0.233
0.57%
1 gen 2014 anni
46.067
+4.723
11.42%
1 gen 2015 anni
43.963
-2.104
-4.57%
Classificazione dei paesi secondo i statistiche attuali per anni