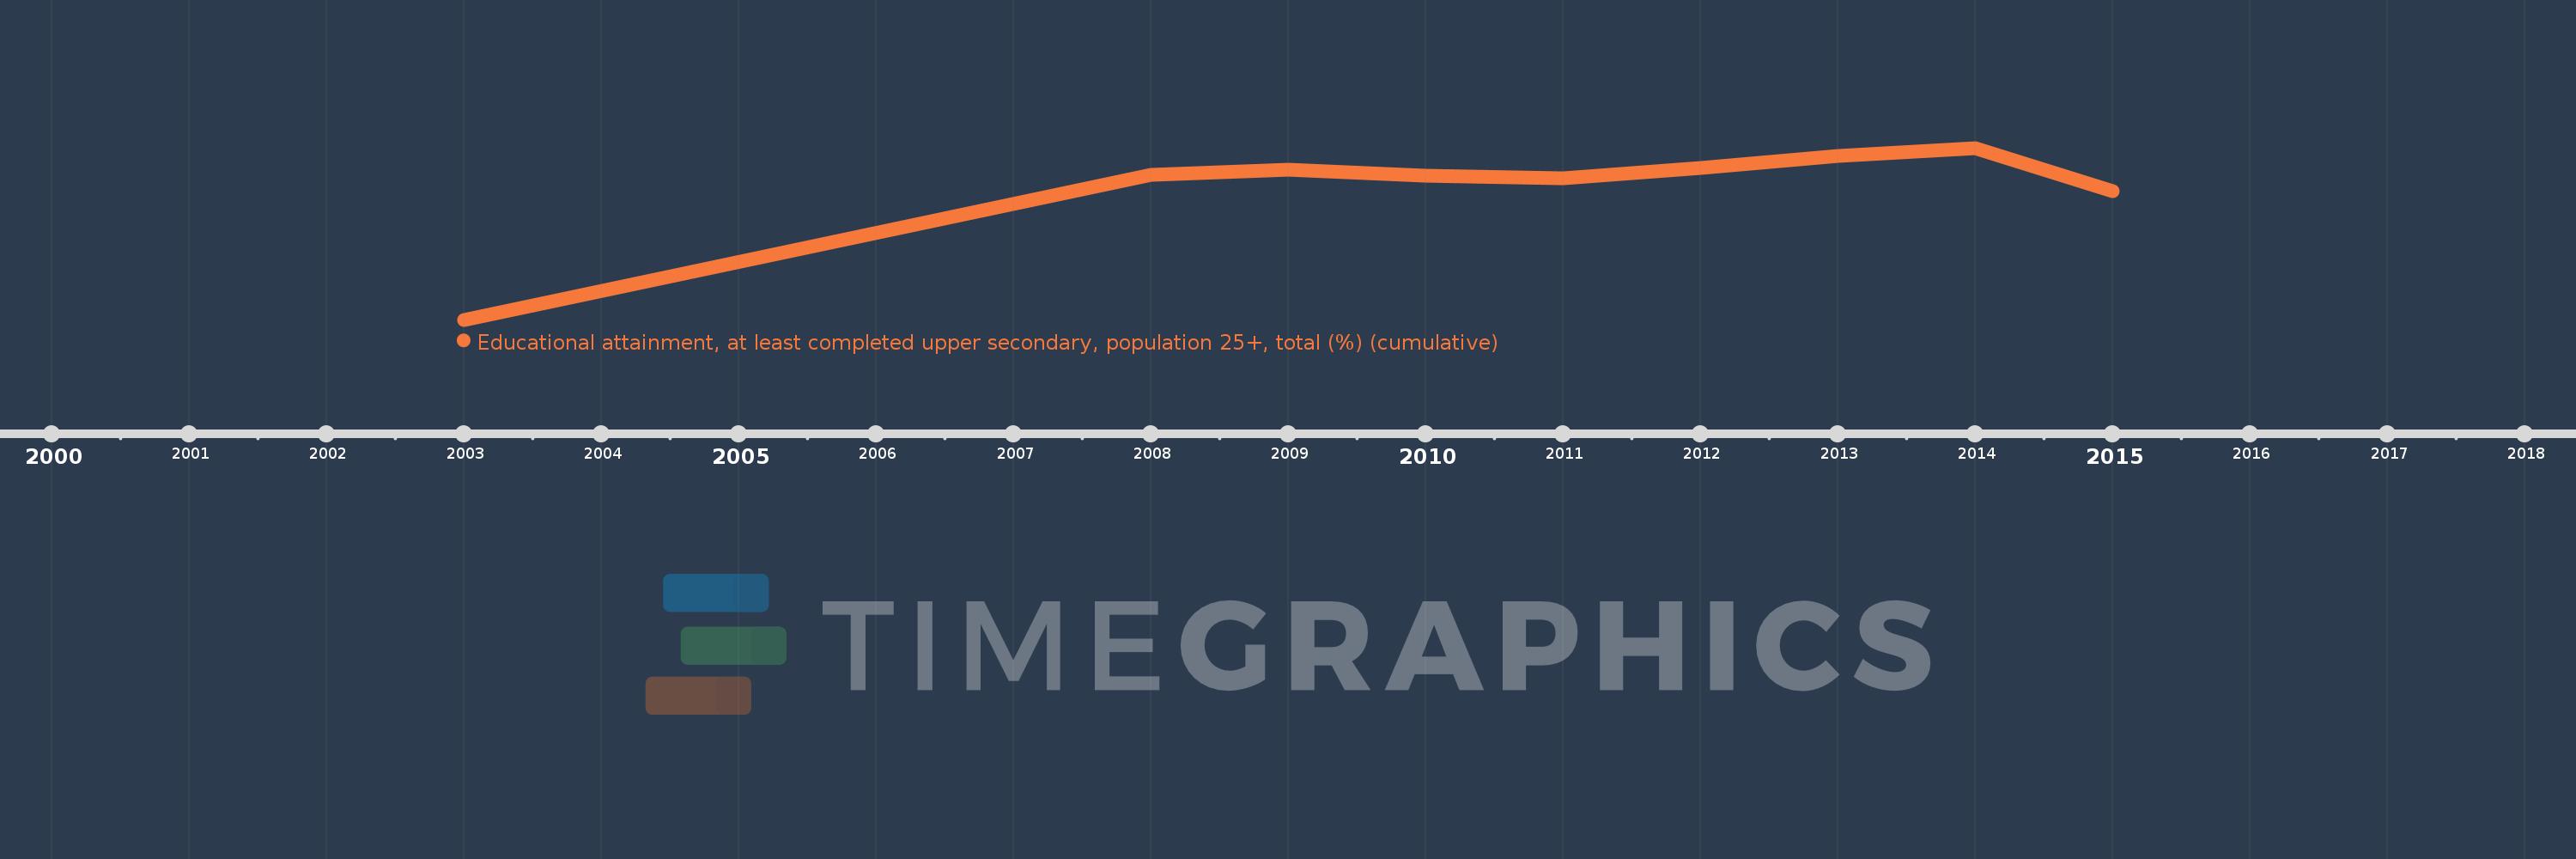
Questa scala temporale mostra un grafico dal 2003 anno al 2015 anno. Romania. I dati fino ad 2002 anno non disponibili. Il numero di osservazioni attuali secondo i date: 9.
La fonte (nome):
Indicatori dello sviluppo mondiale
La fonte (organizzazione):
United Nations Educational, Scientific, and Cultural Organization (UNESCO) Institute for Statistics.
Categorie:
Education, Gender
sono stati aggiornati
23 apr 2017 anni
Indicatori delle variazioni dei valori per anni
In media:
63.338
Minima:
52.653
1 gen 2003 anni
Massimo:
66.459
1 gen 2014 anni
Alla data di osservazione
Valore
Variazione assoluta
La variazione rispetto al valore precedente
1 gen 2003 anni
52.653
+52.653
0.0%
1 gen 2008 anni
64.272
+11.619
22.07%
1 gen 2009 anni
64.718
+0.446
0.69%
1 gen 2010 anni
64.227
-0.49
-0.76%
1 gen 2011 anni
64.032
-0.196
-0.3%
1 gen 2012 anni
64.862
+0.83
1.3%
1 gen 2013 anni
65.838
+0.977
1.51%
1 gen 2014 anni
66.459
+0.621
0.94%
1 gen 2015 anni
62.981
-3.478
-5.23%
Classificazione dei paesi secondo i statistiche attuali per anni