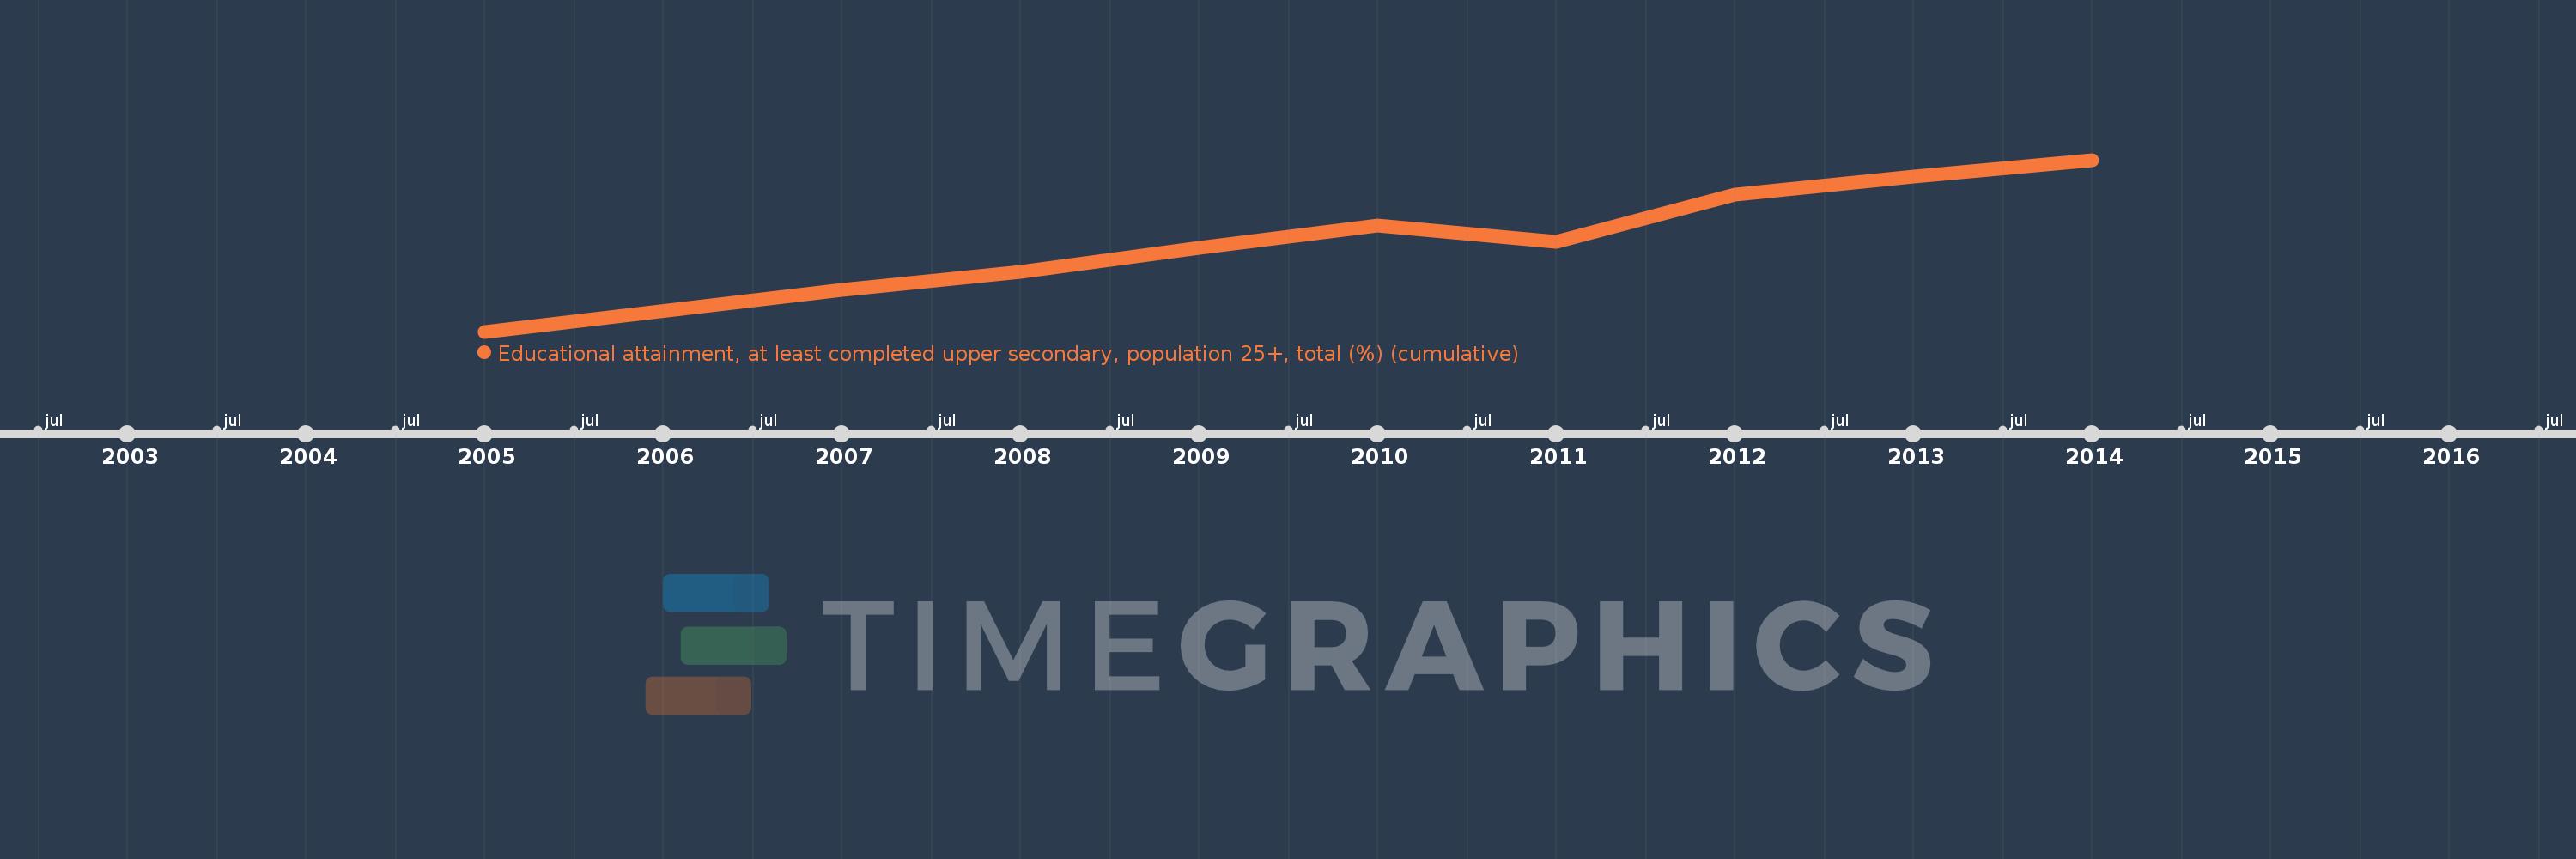
Questa scala temporale mostra un grafico dal 2005 anno al 2014 anno. Brazil. I dati fino ad 2004 anno non disponibili. Il numero di osservazioni attuali secondo i date: 9.
La fonte (nome):
Indicatori dello sviluppo mondiale
La fonte (organizzazione):
United Nations Educational, Scientific, and Cultural Organization (UNESCO) Institute for Statistics.
Categorie:
Education, Gender
sono stati aggiornati
23 apr 2017 anni
Indicatori delle variazioni dei valori per anni
In media:
36.21
Minima:
29.416
1 gen 2005 anni
Massimo:
41.854
1 gen 2014 anni
Alla data di osservazione
Valore
Variazione assoluta
La variazione rispetto al valore precedente
1 gen 2005 anni
29.416
+29.416
0.0%
1 gen 2007 anni
32.421
+3.005
10.22%
1 gen 2008 anni
33.746
+1.324
4.09%
1 gen 2009 anni
35.454
+1.709
5.06%
1 gen 2010 anni
37.107
+1.652
4.66%
1 gen 2011 anni
35.923
-1.184
-3.19%
1 gen 2012 anni
39.361
+3.438
9.57%
1 gen 2013 anni
40.611
+1.25
3.18%
1 gen 2014 anni
41.854
+1.242
3.06%
Classificazione dei paesi secondo i statistiche attuali per anni