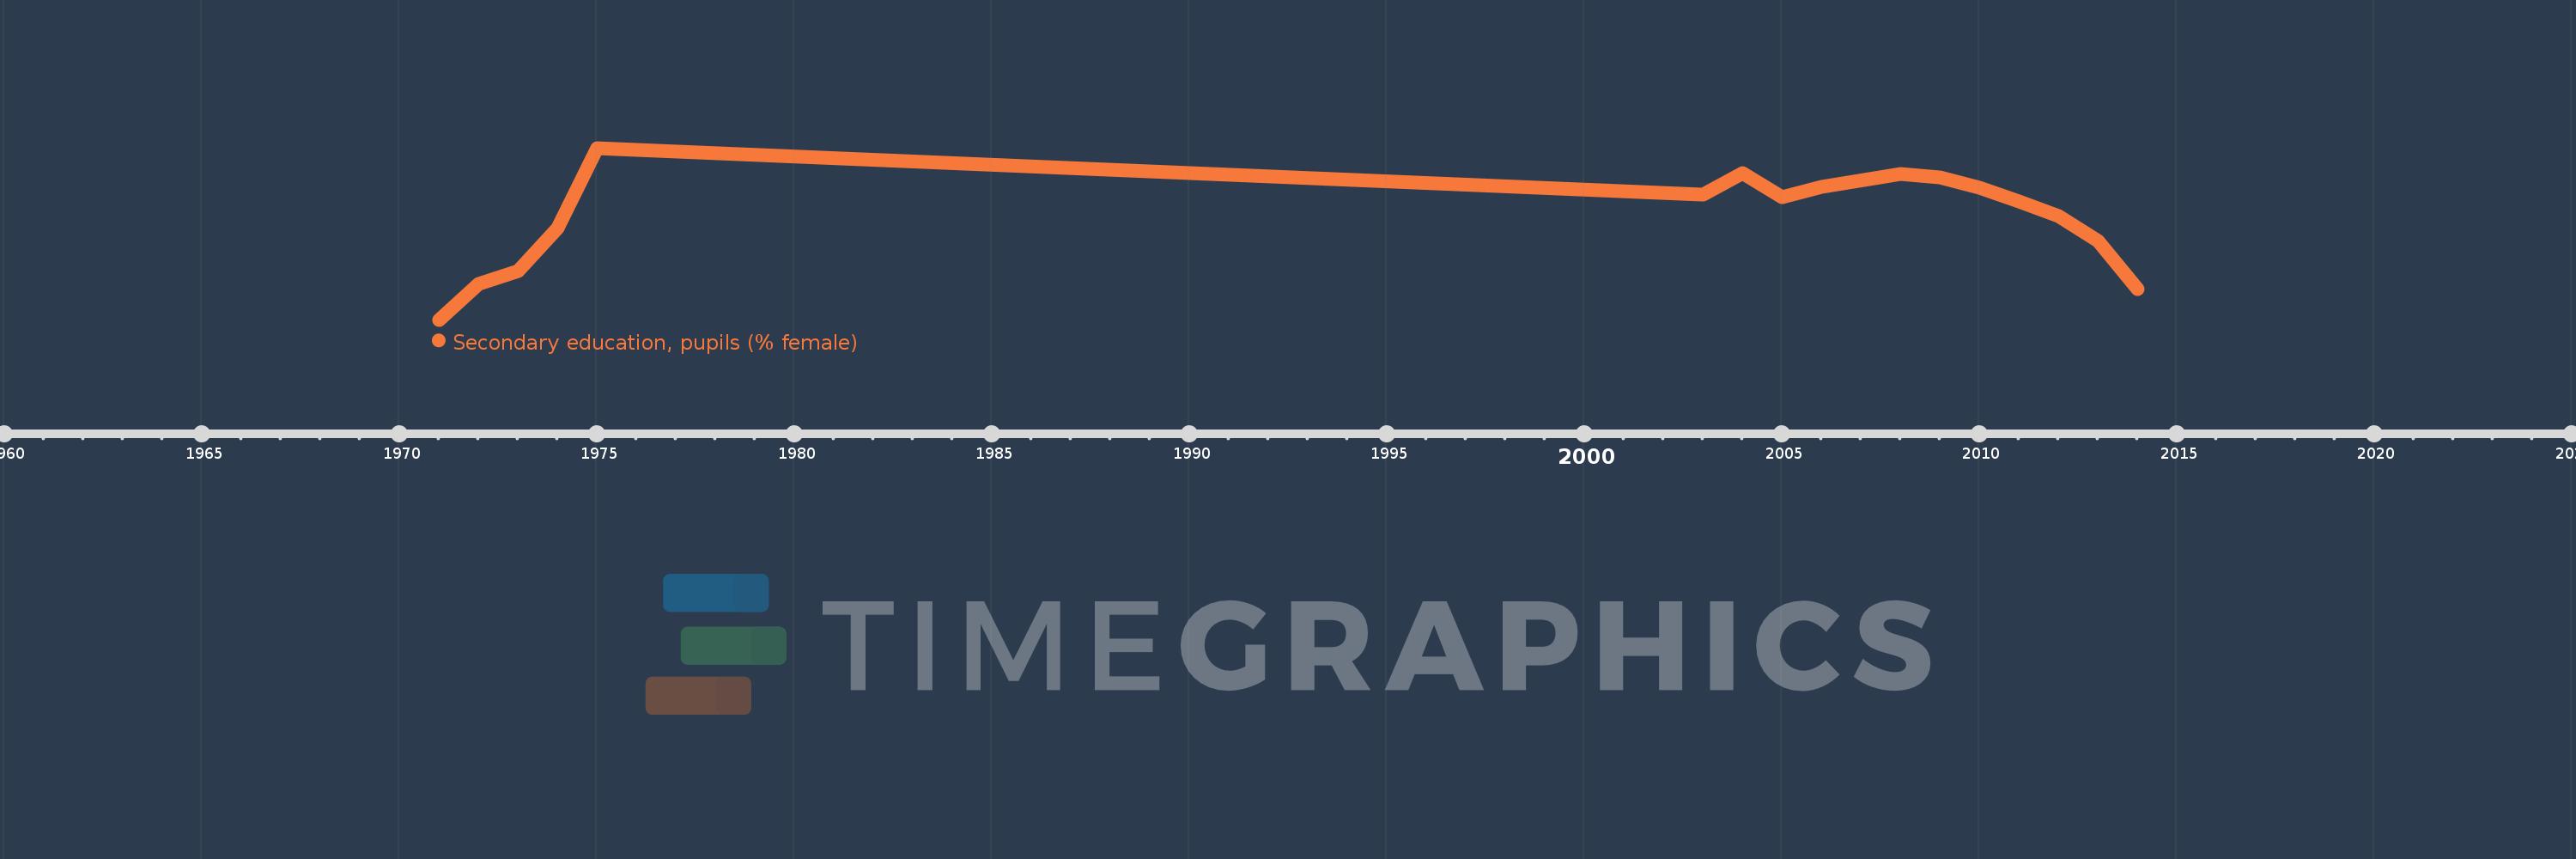
Questa scala temporale mostra un grafico dal 1971 anno al 2014 anno. Brazil. I dati fino ad 1970 anno non disponibili. Il numero di osservazioni attuali secondo i date: 16.
La fonte (nome):
Indicatori dello sviluppo mondiale
La fonte (organizzazione):
United Nations Educational, Scientific, and Cultural Organization (UNESCO) Institute for Statistics.
Categorie:
Education, Gender
sono stati aggiornati
23 apr 2017 anni
Indicatori delle variazioni dei valori per anni
In media:
51.353
Minima:
50.466
1 gen 1971 anni
Massimo:
51.965
1 gen 1975 anni
Alla data di osservazione
Valore
Variazione assoluta
La variazione rispetto al valore precedente
1 gen 1971 anni
50.466
+50.466
0.0%
1 gen 1972 anni
50.779
+0.313
0.62%
1 gen 1973 anni
50.889
+0.111
0.22%
1 gen 1974 anni
51.264
+0.375
0.74%
1 gen 1975 anni
51.965
+0.701
1.37%
1 gen 2003 anni
51.558
-0.407
-0.78%
1 gen 2004 anni
51.747
+0.189
0.37%
1 gen 2005 anni
51.538
-0.21
-0.41%
1 gen 2006 anni
51.623
+0.085
0.17%
1 gen 2008 anni
51.735
+0.113
0.22%
1 gen 2009 anni
51.706
-0.029
-0.06%
1 gen 2010 anni
51.619
-0.087
-0.17%
1 gen 2011 anni
51.498
-0.121
-0.23%
1 gen 2012 anni
51.368
-0.131
-0.25%
1 gen 2013 anni
51.154
-0.213
-0.42%
1 gen 2014 anni
50.731
-0.424
-0.83%
Classificazione dei paesi secondo i statistiche attuali per anni