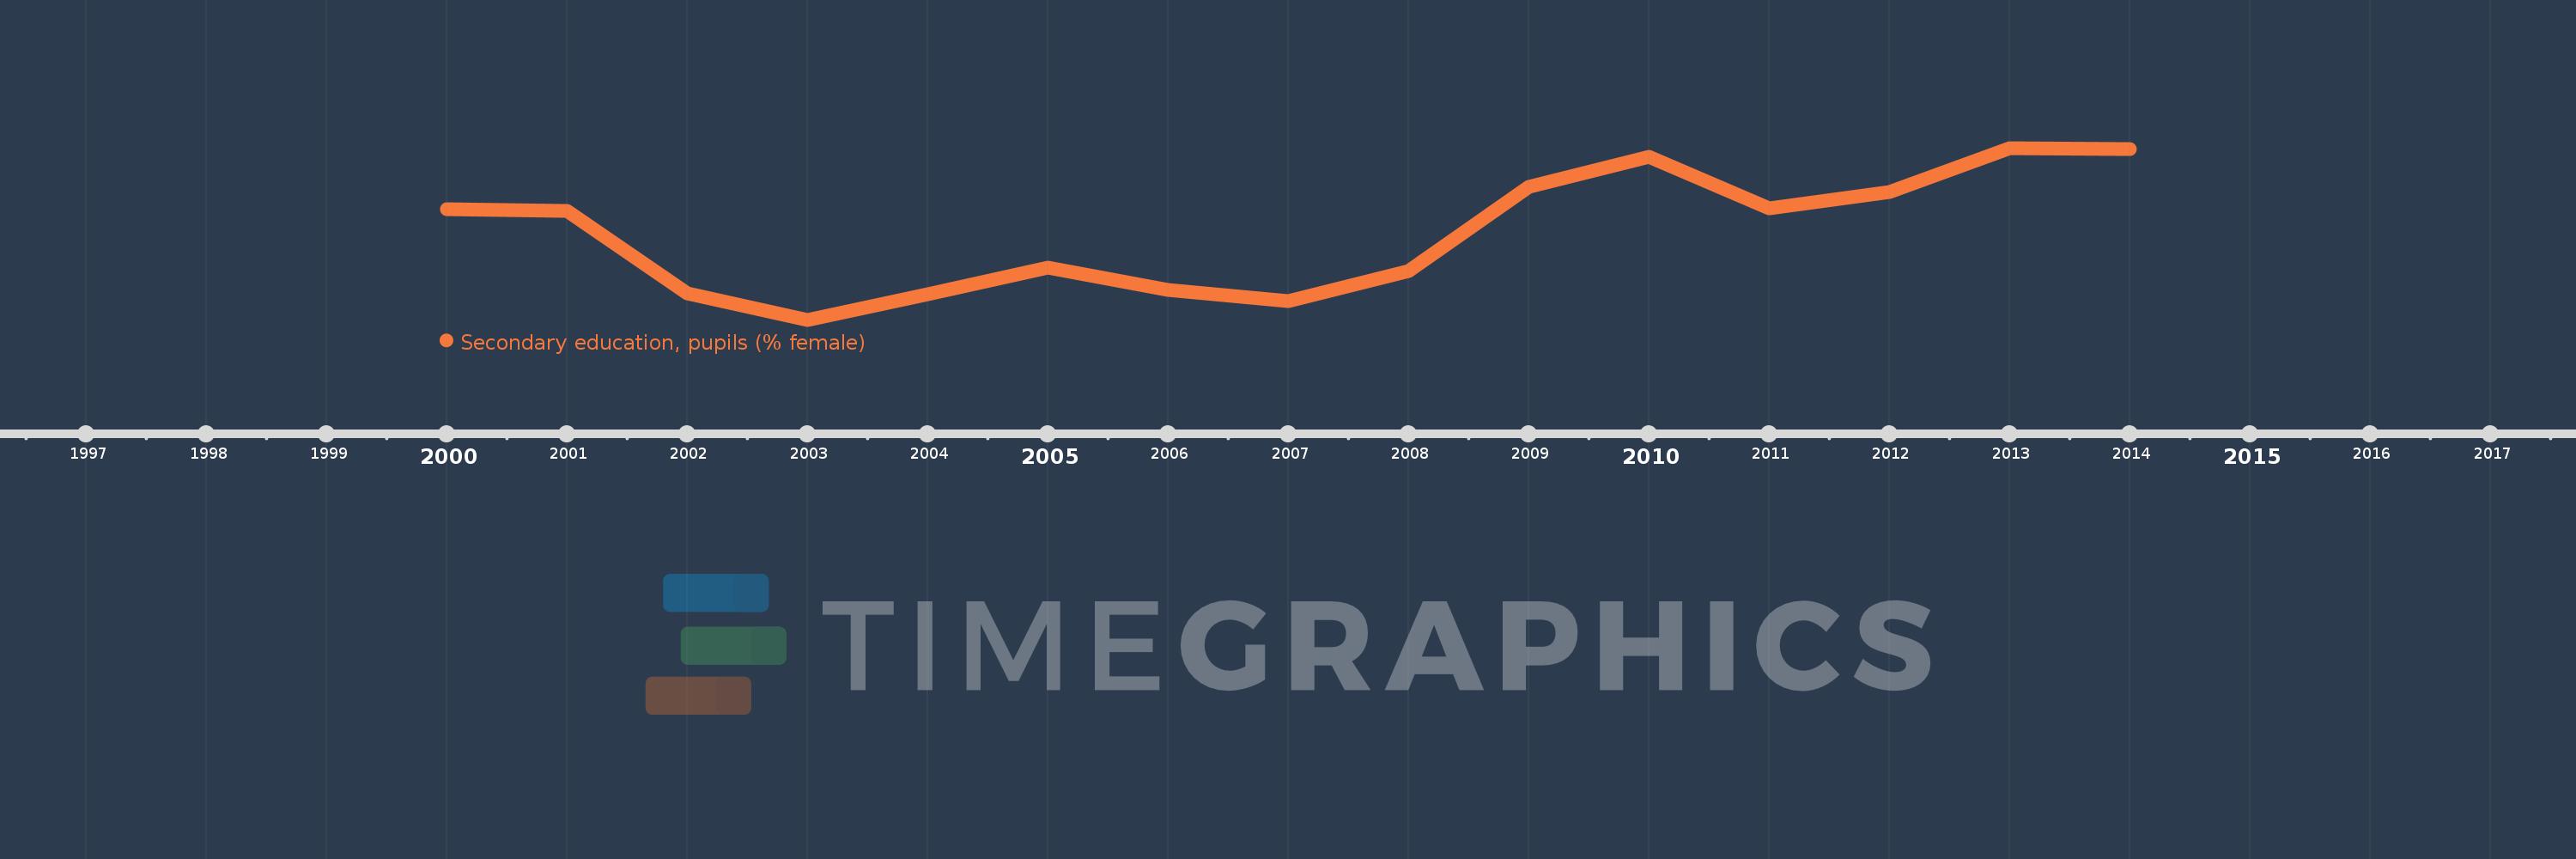
Questa scala temporale mostra un grafico dal 2000 anno al 2014 anno. Tajikistan. I dati fino ad 1999 anno non disponibili. Il numero di osservazioni attuali secondo i date: 15.
La fonte (nome):
Indicatori dello sviluppo mondiale
La fonte (organizzazione):
United Nations Educational, Scientific, and Cultural Organization (UNESCO) Institute for Statistics.
Categorie:
Education, Gender
sono stati aggiornati
23 apr 2017 anni
Indicatori delle variazioni dei valori per anni
In media:
45.396
Minima:
44.546
1 gen 2003 anni
Massimo:
46.232
1 gen 2013 anni
Alla data di osservazione
Valore
Variazione assoluta
La variazione rispetto al valore precedente
1 gen 2000 anni
45.63
+45.63
0.0%
1 gen 2001 anni
45.614
-0.017
-0.04%
1 gen 2002 anni
44.809
-0.805
-1.76%
1 gen 2003 anni
44.546
-0.263
-0.59%
1 gen 2004 anni
44.795
+0.249
0.56%
1 gen 2005 anni
45.058
+0.263
0.59%
1 gen 2006 anni
44.842
-0.216
-0.48%
1 gen 2007 anni
44.729
-0.113
-0.25%
1 gen 2008 anni
45.027
+0.298
0.67%
1 gen 2009 anni
45.852
+0.825
1.83%
1 gen 2010 anni
46.144
+0.292
0.64%
1 gen 2011 anni
45.636
-0.508
-1.1%
1 gen 2012 anni
45.8
+0.164
0.36%
1 gen 2013 anni
46.232
+0.432
0.94%
1 gen 2014 anni
46.219
-0.013
-0.03%
Classificazione dei paesi secondo i statistiche attuali per anni