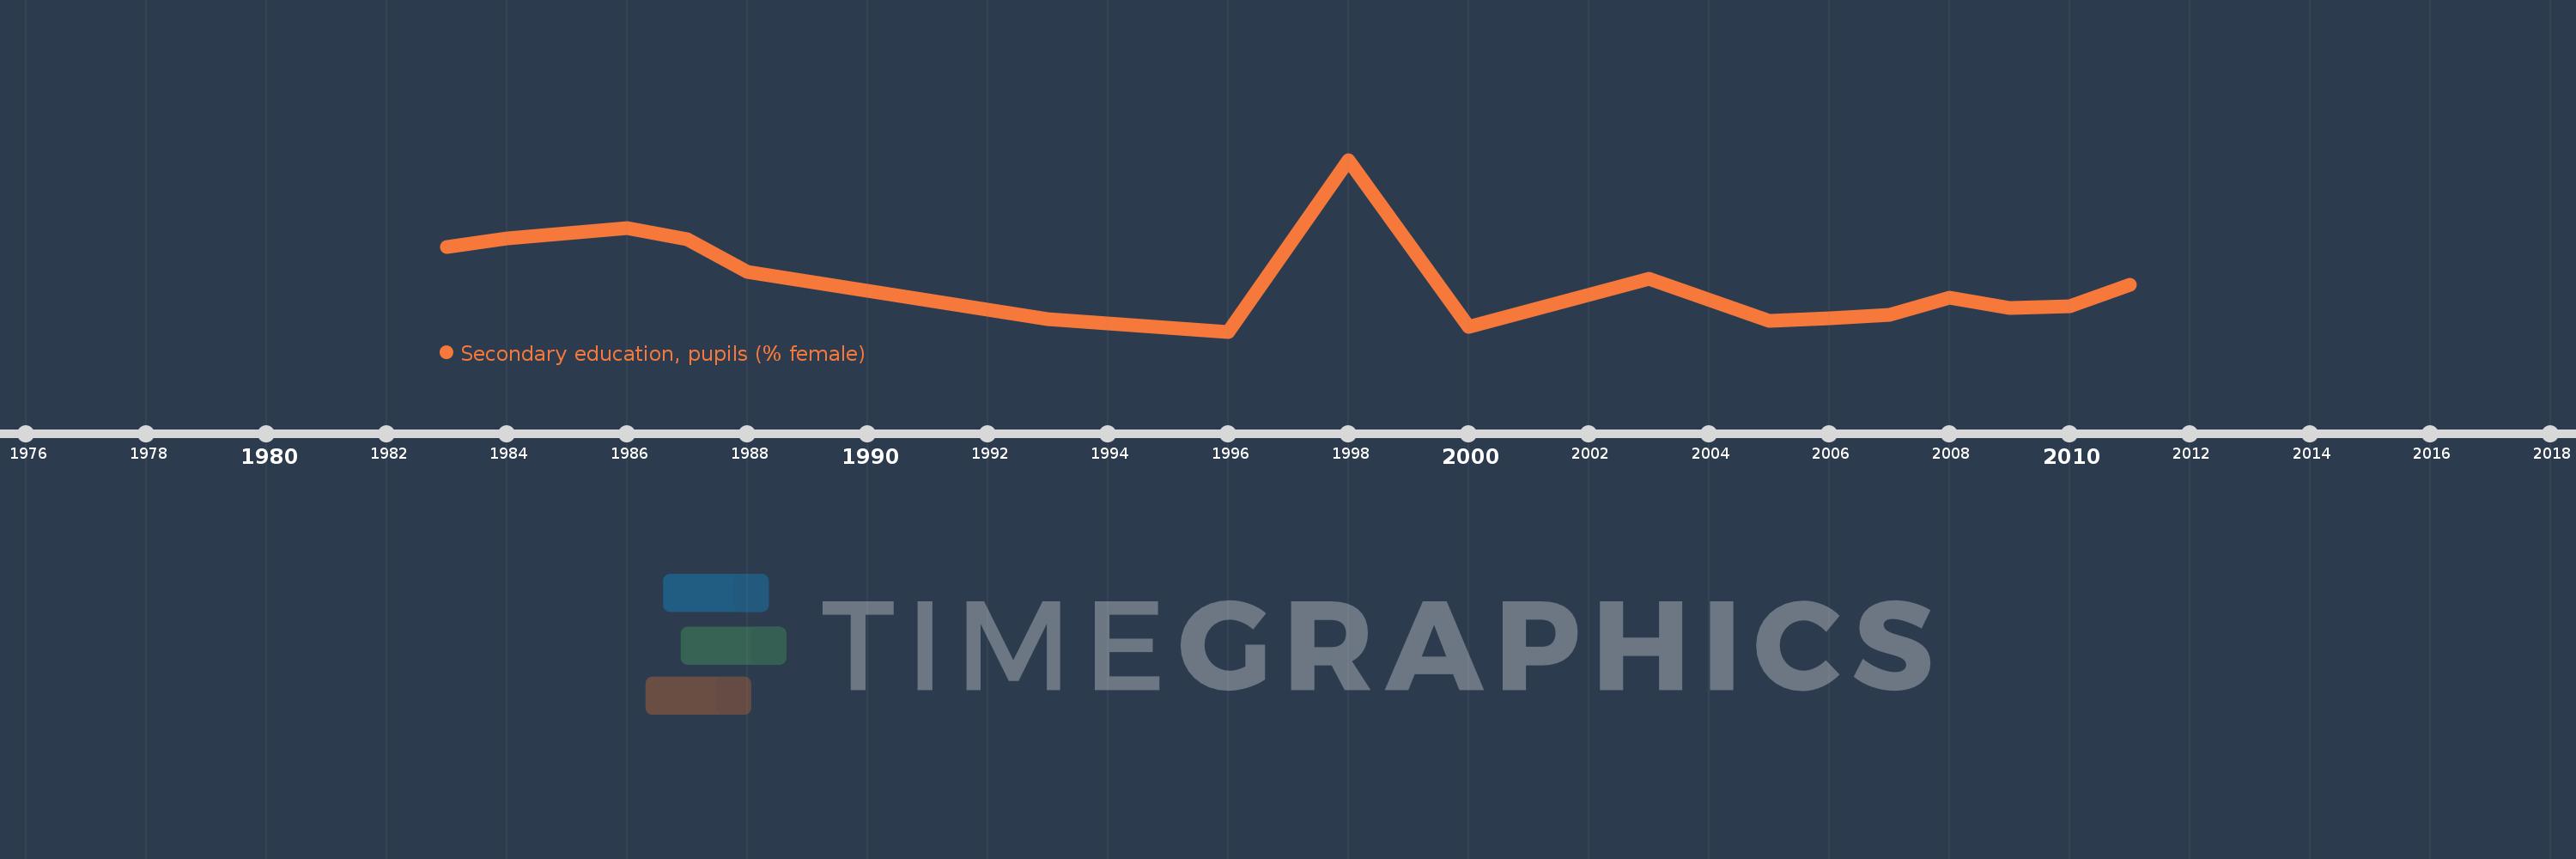
Questa scala temporale mostra un grafico dal 1983 anno al 2011 anno. Bahamas, The. I dati fino ad 1982 anno non disponibili. Il numero di osservazioni attuali secondo i date: 18.
La fonte (nome):
Indicatori dello sviluppo mondiale
La fonte (organizzazione):
United Nations Educational, Scientific, and Cultural Organization (UNESCO) Institute for Statistics.
Categorie:
Education, Gender
sono stati aggiornati
23 apr 2017 anni
Indicatori delle variazioni dei valori per anni
In media:
50.843
Minima:
49.253
1 gen 1996 anni
Massimo:
54.998
1 gen 1998 anni
Alla data di osservazione
Valore
Variazione assoluta
La variazione rispetto al valore precedente
1 gen 1983 anni
52.086
+52.086
0.0%
1 gen 1984 anni
52.356
+0.27
0.52%
1 gen 1986 anni
52.728
+0.371
0.71%
1 gen 1987 anni
52.34
-0.388
-0.73%
1 gen 1988 anni
51.258
-1.082
-2.07%
1 gen 1993 anni
49.657
-1.602
-3.12%
1 gen 1994 anni
49.533
-0.124
-0.25%
1 gen 1996 anni
49.253
-0.28
-0.57%
1 gen 1998 anni
54.998
+5.746
11.67%
1 gen 2000 anni
49.425
-5.573
-10.13%
1 gen 2003 anni
51.026
+1.601
3.24%
1 gen 2005 anni
49.622
-1.404
-2.75%
1 gen 2006 anni
49.706
+0.083
0.17%
1 gen 2007 anni
49.8
+0.094
0.19%
1 gen 2008 anni
50.393
+0.593
1.19%
1 gen 2009 anni
50.057
-0.336
-0.67%
1 gen 2010 anni
50.099
+0.043
0.08%
1 gen 2011 anni
50.831
+0.732
1.46%
Classificazione dei paesi secondo i statistiche attuali per anni