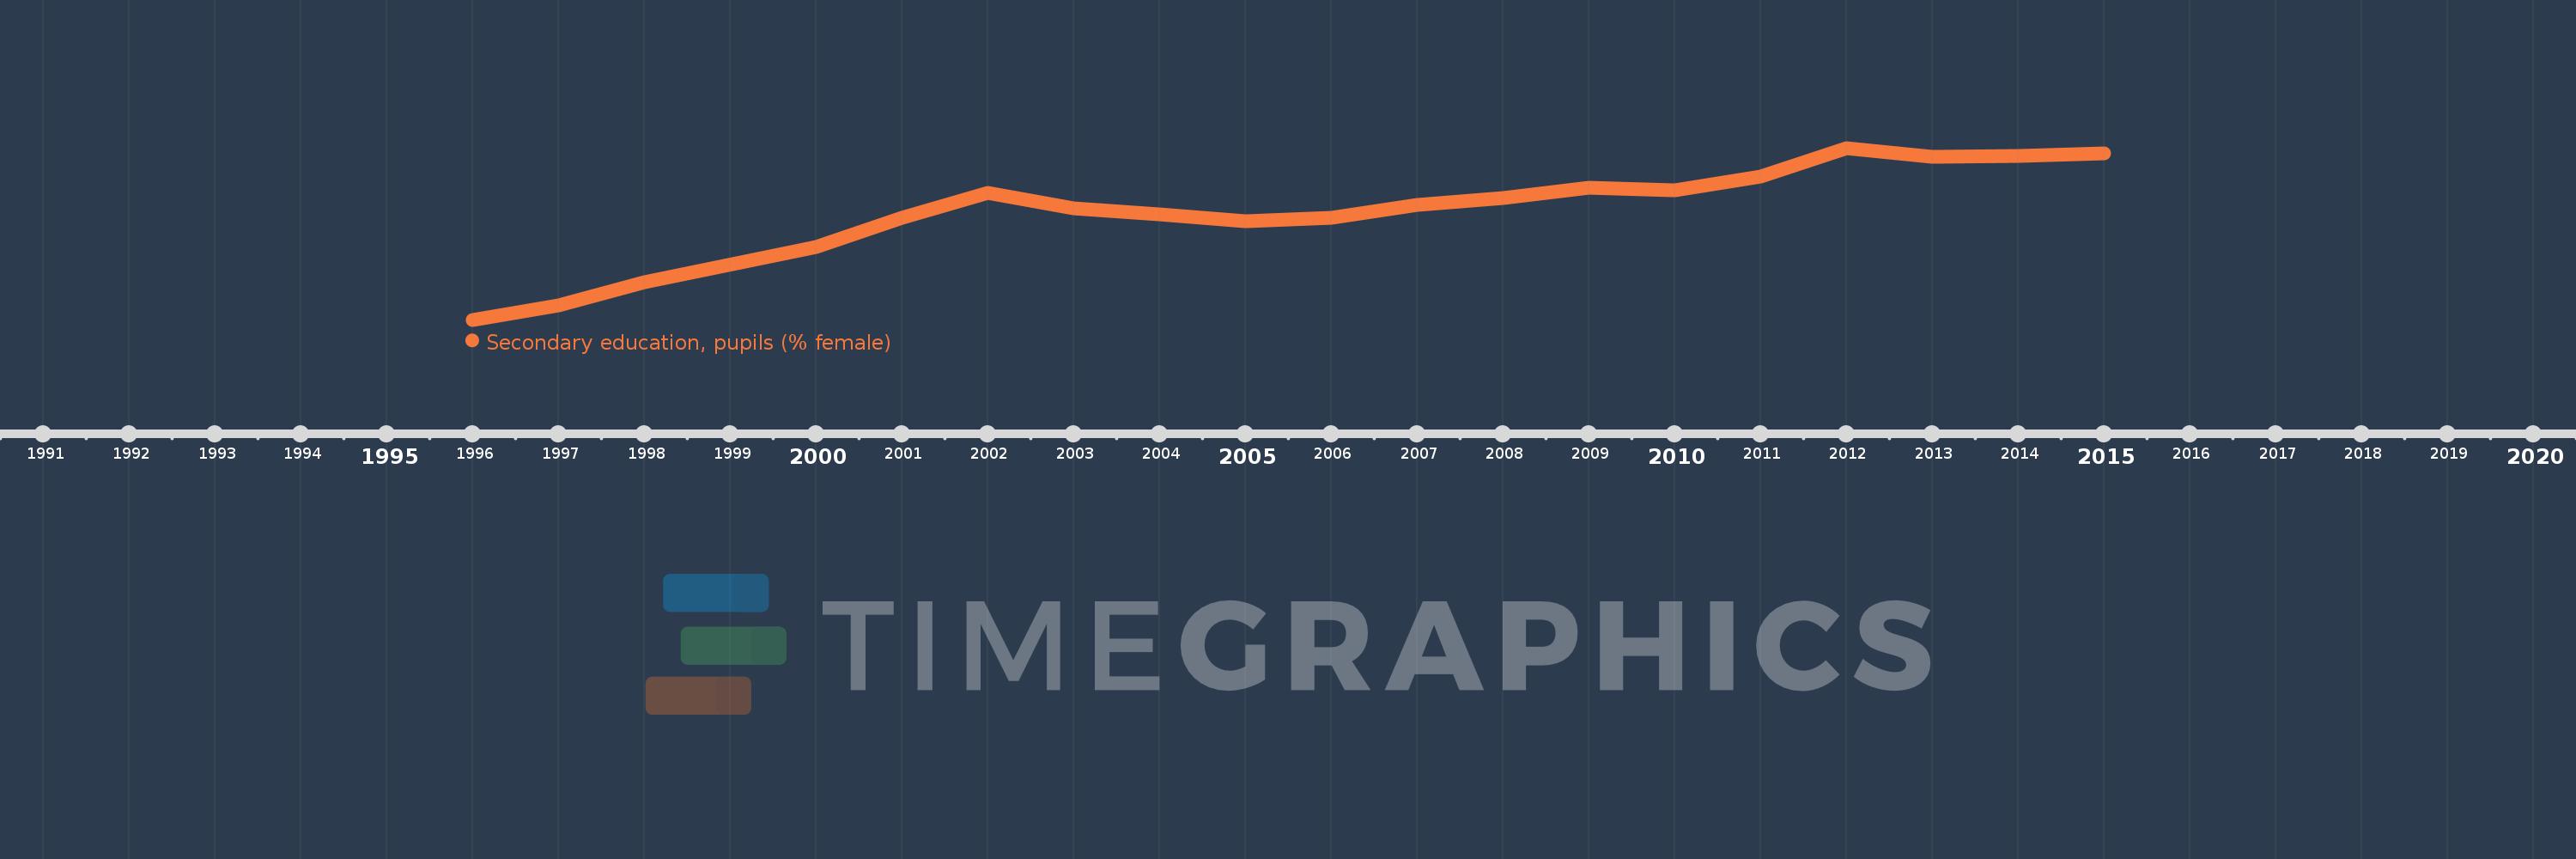
Questa scala temporale mostra un grafico dal 1996 anno al 2015 anno. West Bank and Gaza. I dati fino ad 1995 anno non disponibili. Il numero di osservazioni attuali secondo i date: 19.
La fonte (nome):
Indicatori dello sviluppo mondiale
La fonte (organizzazione):
United Nations Educational, Scientific, and Cultural Organization (UNESCO) Institute for Statistics.
Categorie:
Education, Gender
sono stati aggiornati
23 apr 2017 anni
Indicatori delle variazioni dei valori per anni
In media:
50.249
Minima:
48.204
1 gen 1996 anni
Massimo:
51.42
1 gen 2012 anni
Alla data di osservazione
Valore
Variazione assoluta
La variazione rispetto al valore precedente
1 gen 1996 anni
48.204
+48.204
0.0%
1 gen 1997 anni
48.468
+0.264
0.55%
1 gen 1998 anni
48.911
+0.444
0.92%
1 gen 2000 anni
49.558
+0.646
1.32%
1 gen 2001 anni
50.116
+0.559
1.13%
1 gen 2002 anni
50.572
+0.455
0.91%
1 gen 2003 anni
50.286
-0.286
-0.56%
1 gen 2004 anni
50.182
-0.104
-0.21%
1 gen 2005 anni
50.051
-0.131
-0.26%
1 gen 2006 anni
50.107
+0.056
0.11%
1 gen 2007 anni
50.348
+0.241
0.48%
1 gen 2008 anni
50.478
+0.13
0.26%
1 gen 2009 anni
50.673
+0.195
0.39%
1 gen 2010 anni
50.632
-0.041
-0.08%
1 gen 2011 anni
50.89
+0.259
0.51%
1 gen 2012 anni
51.42
+0.53
1.04%
1 gen 2013 anni
51.256
-0.164
-0.32%
1 gen 2014 anni
51.265
+0.01
0.02%
1 gen 2015 anni
51.318
+0.052
0.1%
Classificazione dei paesi secondo i statistiche attuali per anni