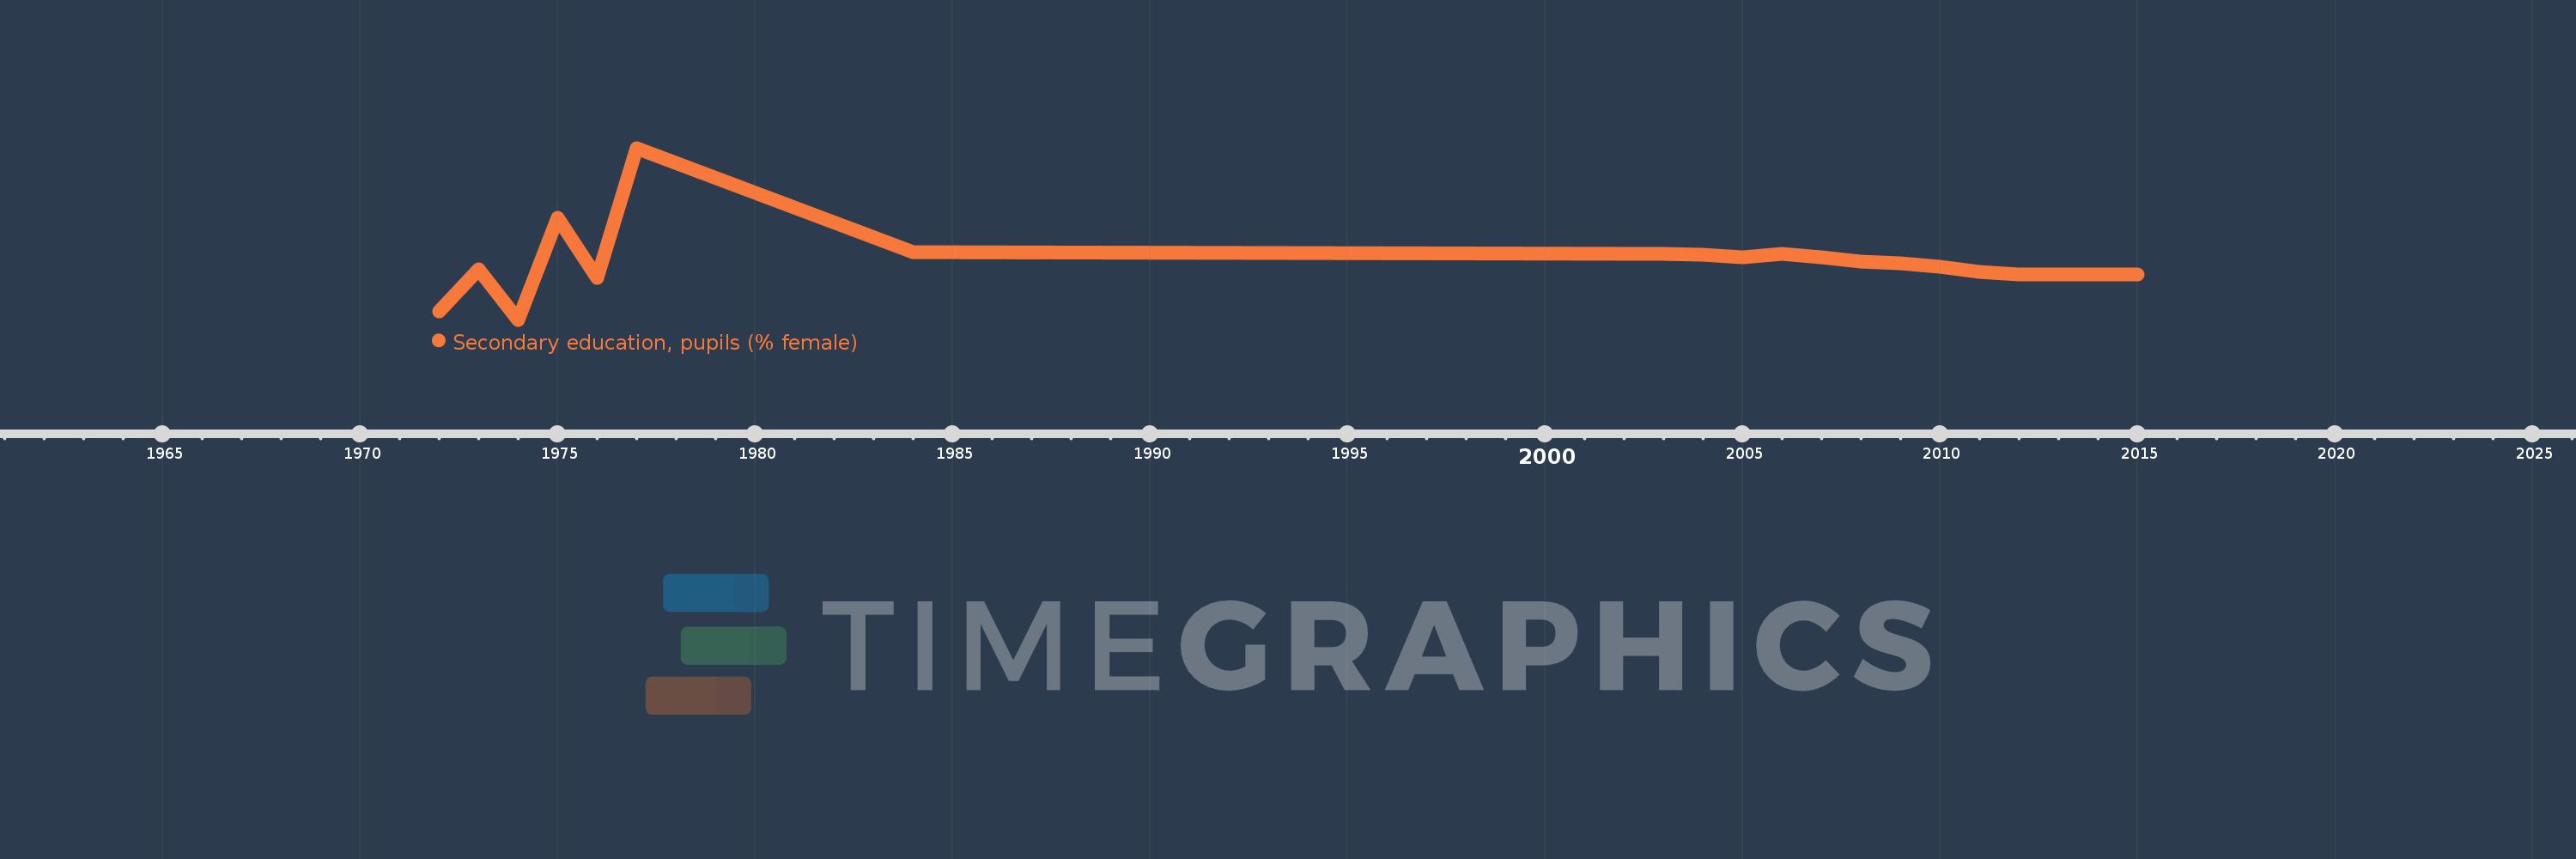
Questa scala temporale mostra un grafico dal 1972 anno al 2015 anno. Andorra. I dati fino ad 1971 anno non disponibili. Il numero di osservazioni attuali secondo i date: 20.
La fonte (nome):
Indicatori dello sviluppo mondiale
La fonte (organizzazione):
United Nations Educational, Scientific, and Cultural Organization (UNESCO) Institute for Statistics.
Categorie:
Education, Gender
sono stati aggiornati
23 apr 2017 anni
Indicatori delle variazioni dei valori per anni
In media:
49.412
Minima:
42.837
1 gen 1974 anni
Massimo:
62.293
1 gen 1977 anni
Alla data di osservazione
Valore
Variazione assoluta
La variazione rispetto al valore precedente
1 gen 1972 anni
43.785
+43.785
0.0%
1 gen 1973 anni
48.548
+4.763
10.88%
1 gen 1974 anni
42.837
-5.711
-11.76%
1 gen 1975 anni
54.382
+11.545
26.95%
1 gen 1976 anni
47.573
-6.809
-12.52%
1 gen 1977 anni
62.293
+14.72
30.94%
1 gen 1984 anni
50.517
-11.777
-18.9%
1 gen 2003 anni
50.255
-0.261
-0.52%
1 gen 2004 anni
50.219
-0.036
-0.07%
1 gen 2005 anni
49.908
-0.311
-0.62%
1 gen 2006 anni
50.281
+0.373
0.75%
1 gen 2007 anni
49.935
-0.346
-0.69%
1 gen 2008 anni
49.437
-0.498
-1.0%
1 gen 2009 anni
49.208
-0.229
-0.46%
1 gen 2010 anni
48.85
-0.358
-0.73%
1 gen 2011 anni
48.288
-0.563
-1.15%
1 gen 2012 anni
47.92
-0.368
-0.76%
1 gen 2013 anni
48.004
+0.084
0.17%
1 gen 2014 anni
48.007
+0.003
0.01%
1 gen 2015 anni
47.997
-0.009
-0.02%
Classificazione dei paesi secondo i statistiche attuali per anni