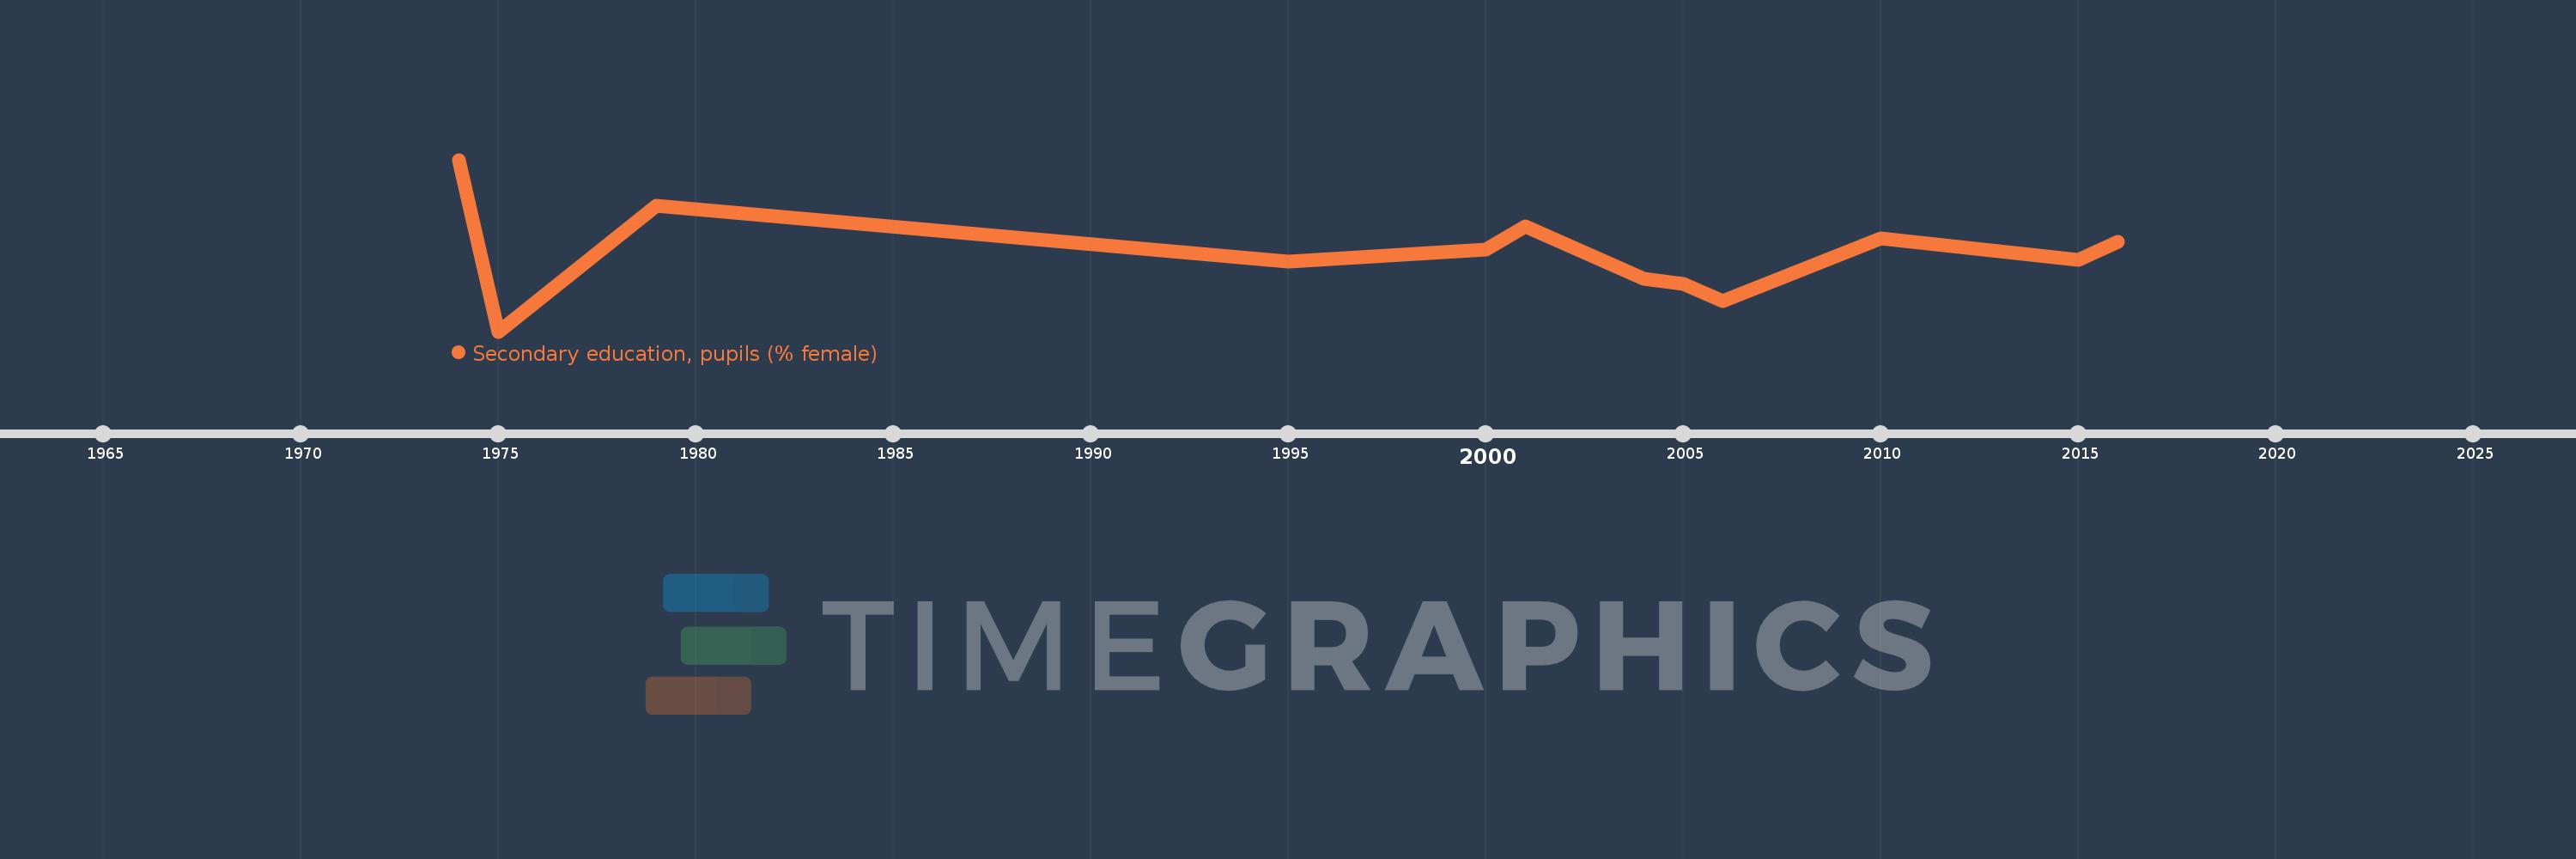
Questa scala temporale mostra un grafico dal 1974 anno al 2016 anno. Turks and Caicos Islands. I dati fino ad 1973 anno non disponibili. Il numero di osservazioni attuali secondo i date: 12.
La fonte (nome):
Indicatori dello sviluppo mondiale
La fonte (organizzazione):
United Nations Educational, Scientific, and Cultural Organization (UNESCO) Institute for Statistics.
Categorie:
Education, Gender
sono stati aggiornati
23 apr 2017 anni
Indicatori delle variazioni dei valori per anni
In media:
50.829
Minima:
45.824
1 gen 1975 anni
Massimo:
56.78
1 gen 1974 anni
Alla data di osservazione
Valore
Variazione assoluta
La variazione rispetto al valore precedente
1 gen 1974 anni
56.78
+56.78
0.0%
1 gen 1975 anni
45.824
-10.955
-19.29%
1 gen 1979 anni
53.868
+8.043
17.55%
1 gen 1995 anni
50.291
-3.577
-6.64%
1 gen 2000 anni
51.077
+0.787
1.56%
1 gen 2001 anni
52.525
+1.448
2.84%
1 gen 2004 anni
49.213
-3.313
-6.31%
1 gen 2005 anni
48.846
-0.367
-0.75%
1 gen 2006 anni
47.754
-1.092
-2.24%
1 gen 2010 anni
51.79
+4.036
8.45%
1 gen 2015 anni
50.414
-1.376
-2.66%
1 gen 2016 anni
51.565
+1.151
2.28%
Classificazione dei paesi secondo i statistiche attuali per anni