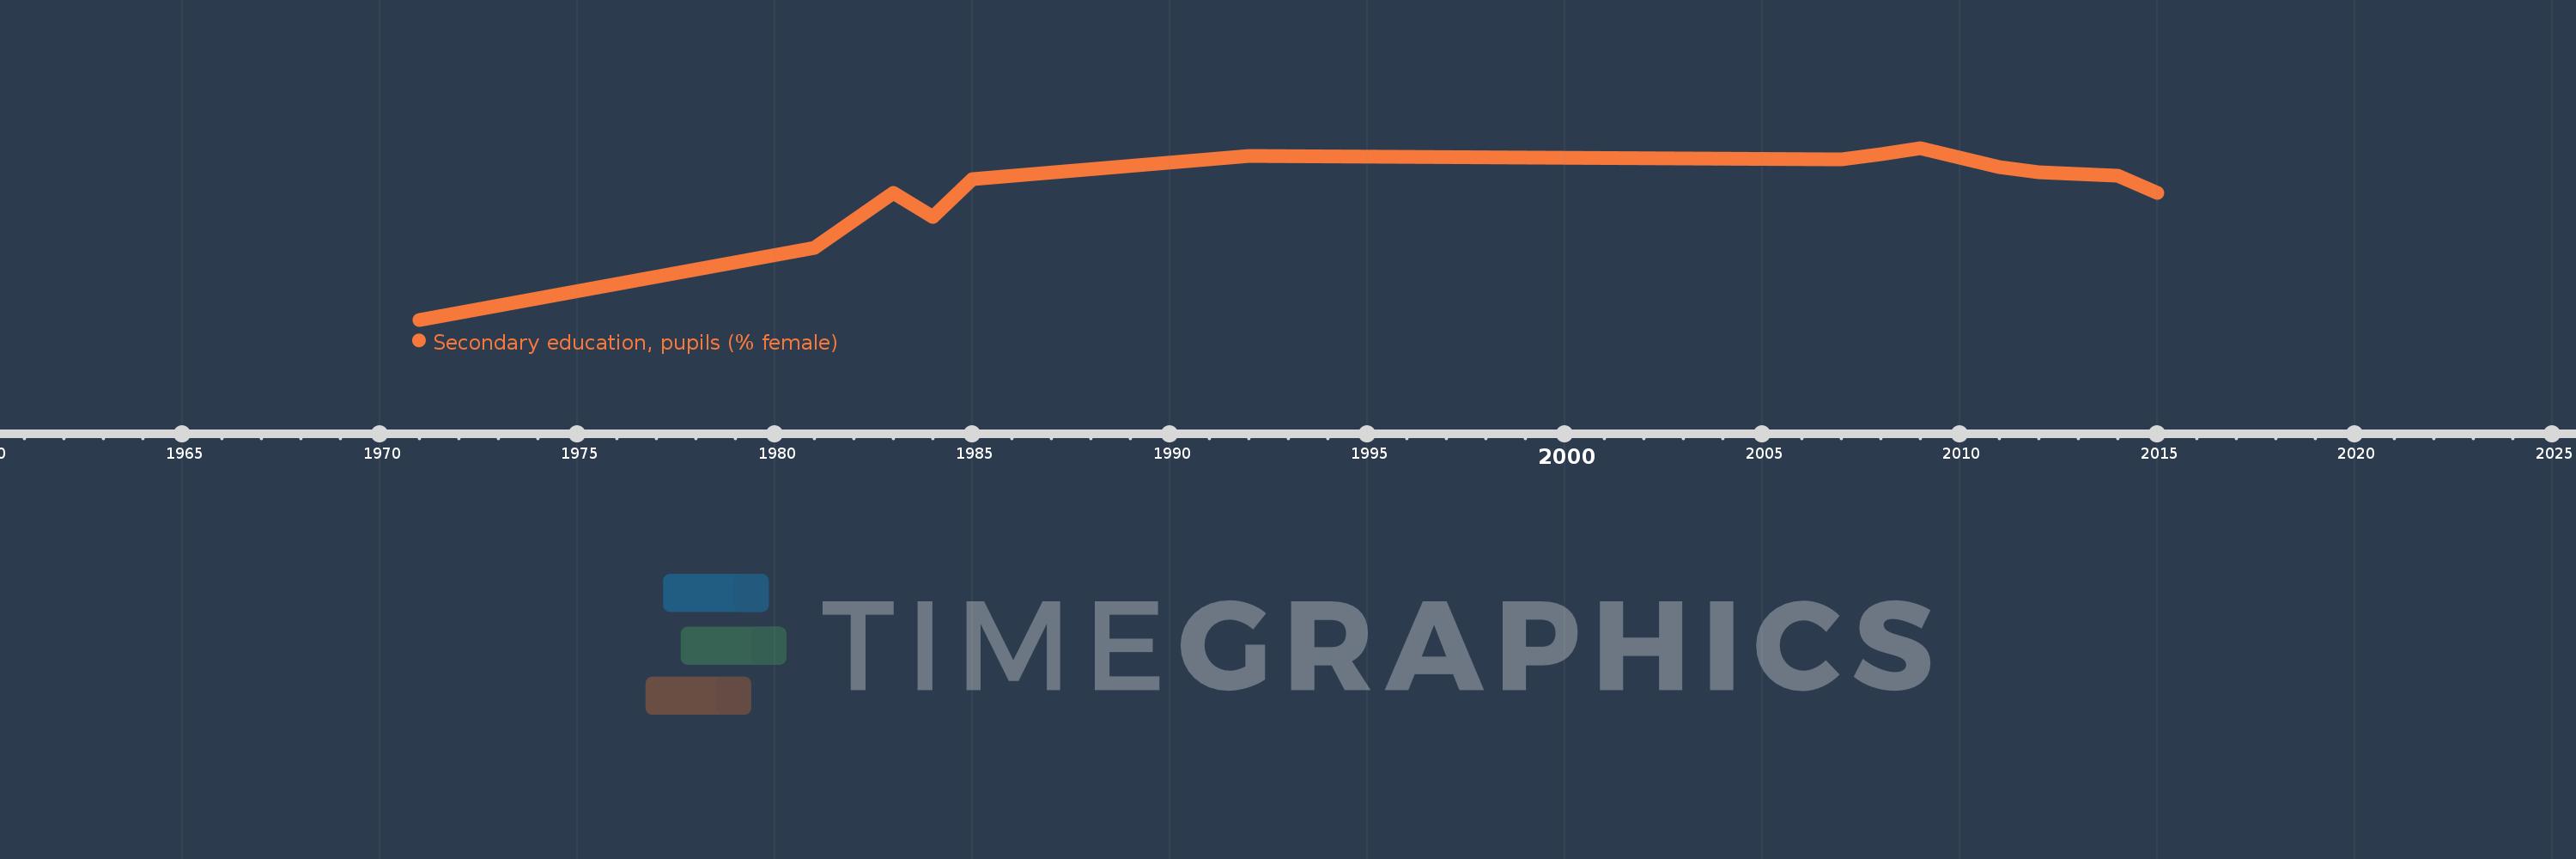
Questa scala temporale mostra un grafico dal 1971 anno al 2015 anno. Honduras. I dati fino ad 1970 anno non disponibili. Il numero di osservazioni attuali secondo i date: 14.
La fonte (nome):
Indicatori dello sviluppo mondiale
La fonte (organizzazione):
United Nations Educational, Scientific, and Cultural Organization (UNESCO) Institute for Statistics.
Categorie:
Education, Gender
sono stati aggiornati
23 apr 2017 anni
Indicatori delle variazioni dei valori per anni
In media:
53.24
Minima:
46.921
1 gen 1971 anni
Massimo:
55.272
1 gen 2009 anni
Alla data di osservazione
Valore
Variazione assoluta
La variazione rispetto al valore precedente
1 gen 1971 anni
46.921
+46.921
0.0%
1 gen 1981 anni
50.421
+3.499
7.46%
1 gen 1983 anni
53.075
+2.654
5.26%
1 gen 1984 anni
51.899
-1.175
-2.21%
1 gen 1985 anni
53.738
+1.839
3.54%
1 gen 1992 anni
54.875
+1.137
2.12%
1 gen 2007 anni
54.731
-0.144
-0.26%
1 gen 2008 anni
54.977
+0.246
0.45%
1 gen 2009 anni
55.272
+0.296
0.54%
1 gen 2011 anni
54.326
-0.946
-1.71%
1 gen 2012 anni
54.103
-0.223
-0.41%
1 gen 2013 anni
54.009
-0.094
-0.17%
1 gen 2014 anni
53.919
-0.089
-0.17%
1 gen 2015 anni
53.091
-0.828
-1.54%
Classificazione dei paesi secondo i statistiche attuali per anni