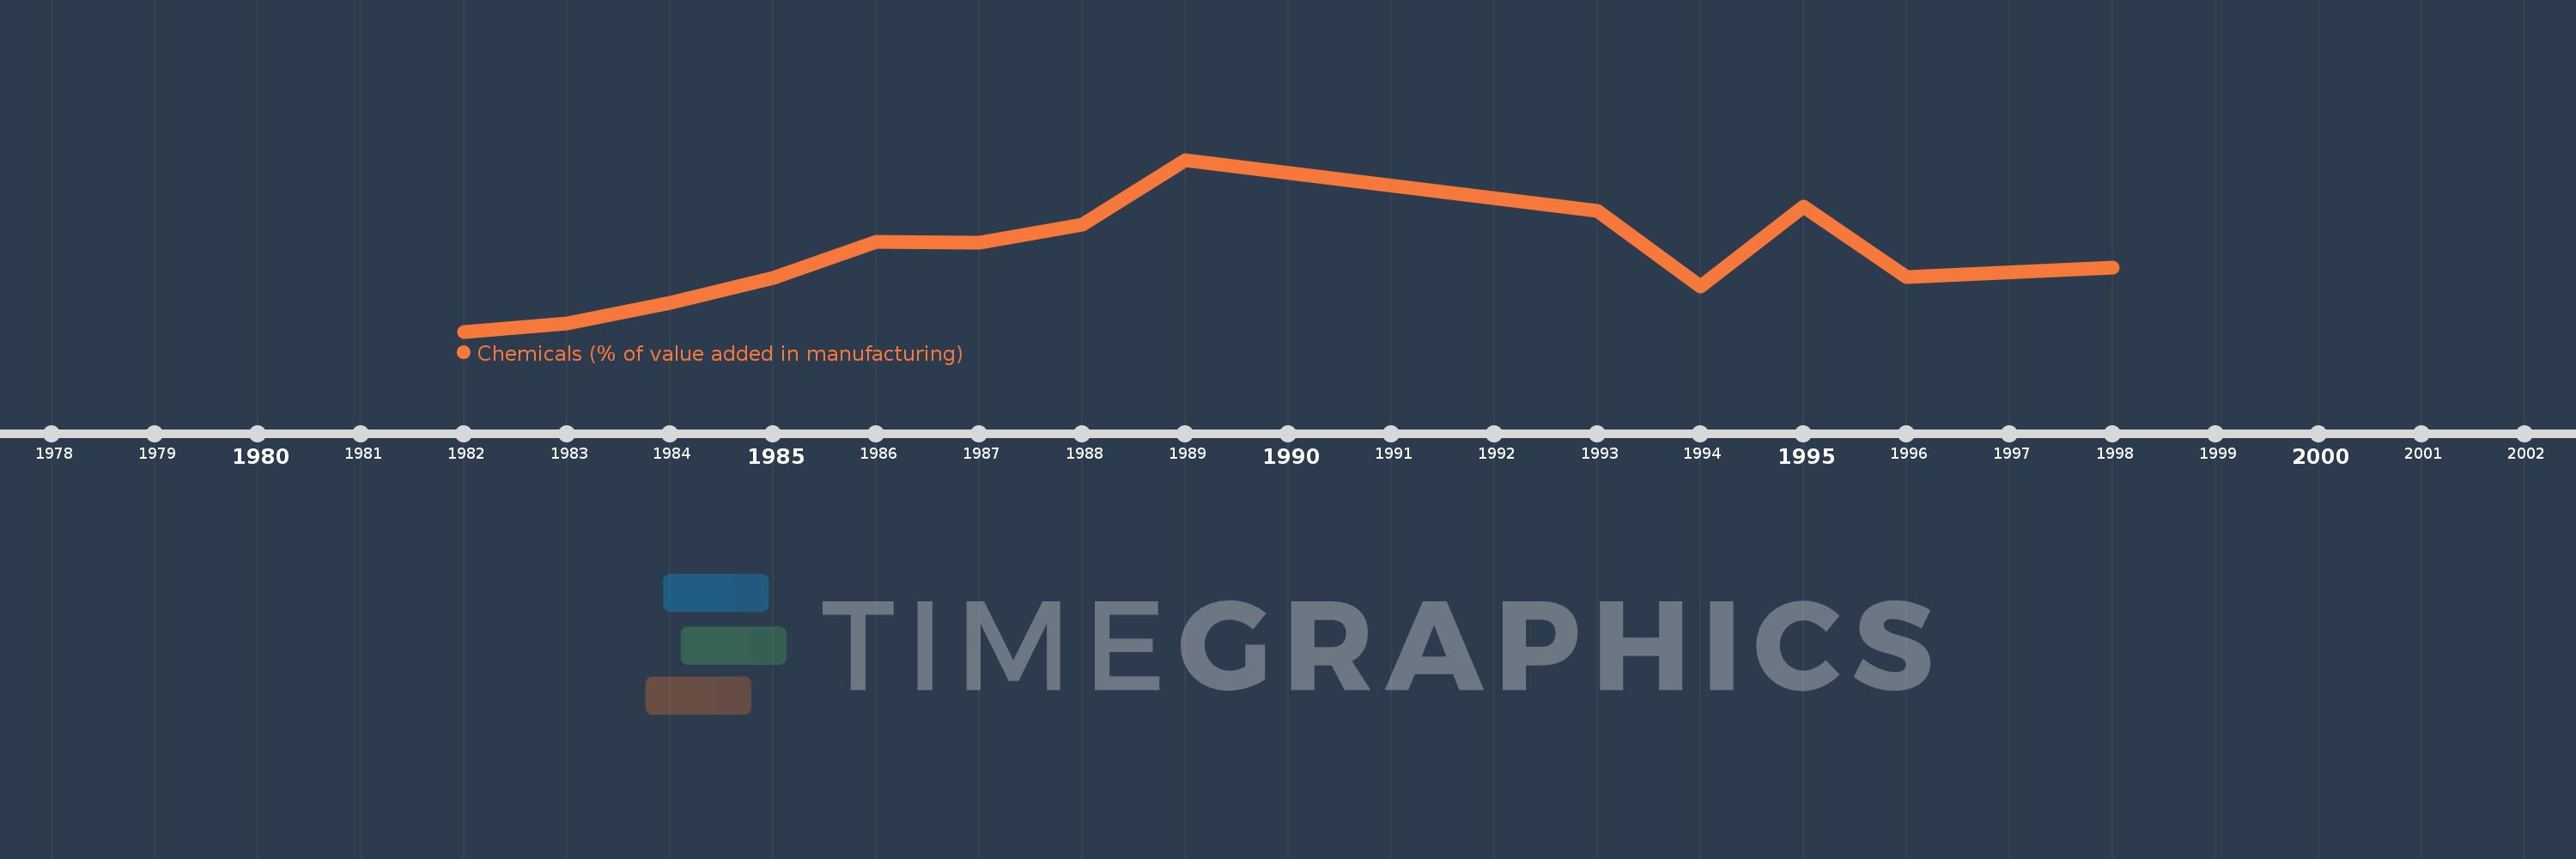
Questa scala temporale mostra un grafico dal 1982 anno al 1998 anno. Botswana. I dati fino ad 1981 anno non disponibili. Il numero di osservazioni attuali secondo i date: 13.
La fonte (nome):
Indicatori dello sviluppo mondiale
La fonte (organizzazione):
United Nations Industrial Development Organization, International Yearbook of Industrial Statistics.
Categorie:
Economy & Growth
sono stati aggiornati
23 apr 2017 anni
Indicatori delle variazioni dei valori per anni
In media:
5.024
Minima:
1.77
1 gen 1982 anni
Massimo:
9.364
1 gen 1989 anni
Alla data di osservazione
Valore
Variazione assoluta
La variazione rispetto al valore precedente
1 gen 1982 anni
1.77
+1.77
0.0%
1 gen 1983 anni
2.138
+0.369
20.82%
1 gen 1984 anni
3.052
+0.913
42.7%
1 gen 1985 anni
4.146
+1.095
35.87%
1 gen 1986 anni
5.747
+1.601
38.61%
1 gen 1987 anni
5.689
-0.058
-1.01%
1 gen 1988 anni
6.497
+0.808
14.21%
1 gen 1989 anni
9.364
+2.866
44.12%
1 gen 1993 anni
7.096
-2.268
-24.22%
1 gen 1994 anni
3.745
-3.351
-47.22%
1 gen 1995 anni
7.298
+3.553
94.87%
1 gen 1996 anni
4.171
-3.127
-42.85%
1 gen 1998 anni
4.6
+0.429
10.28%
Classificazione dei paesi secondo i statistiche attuali per anni