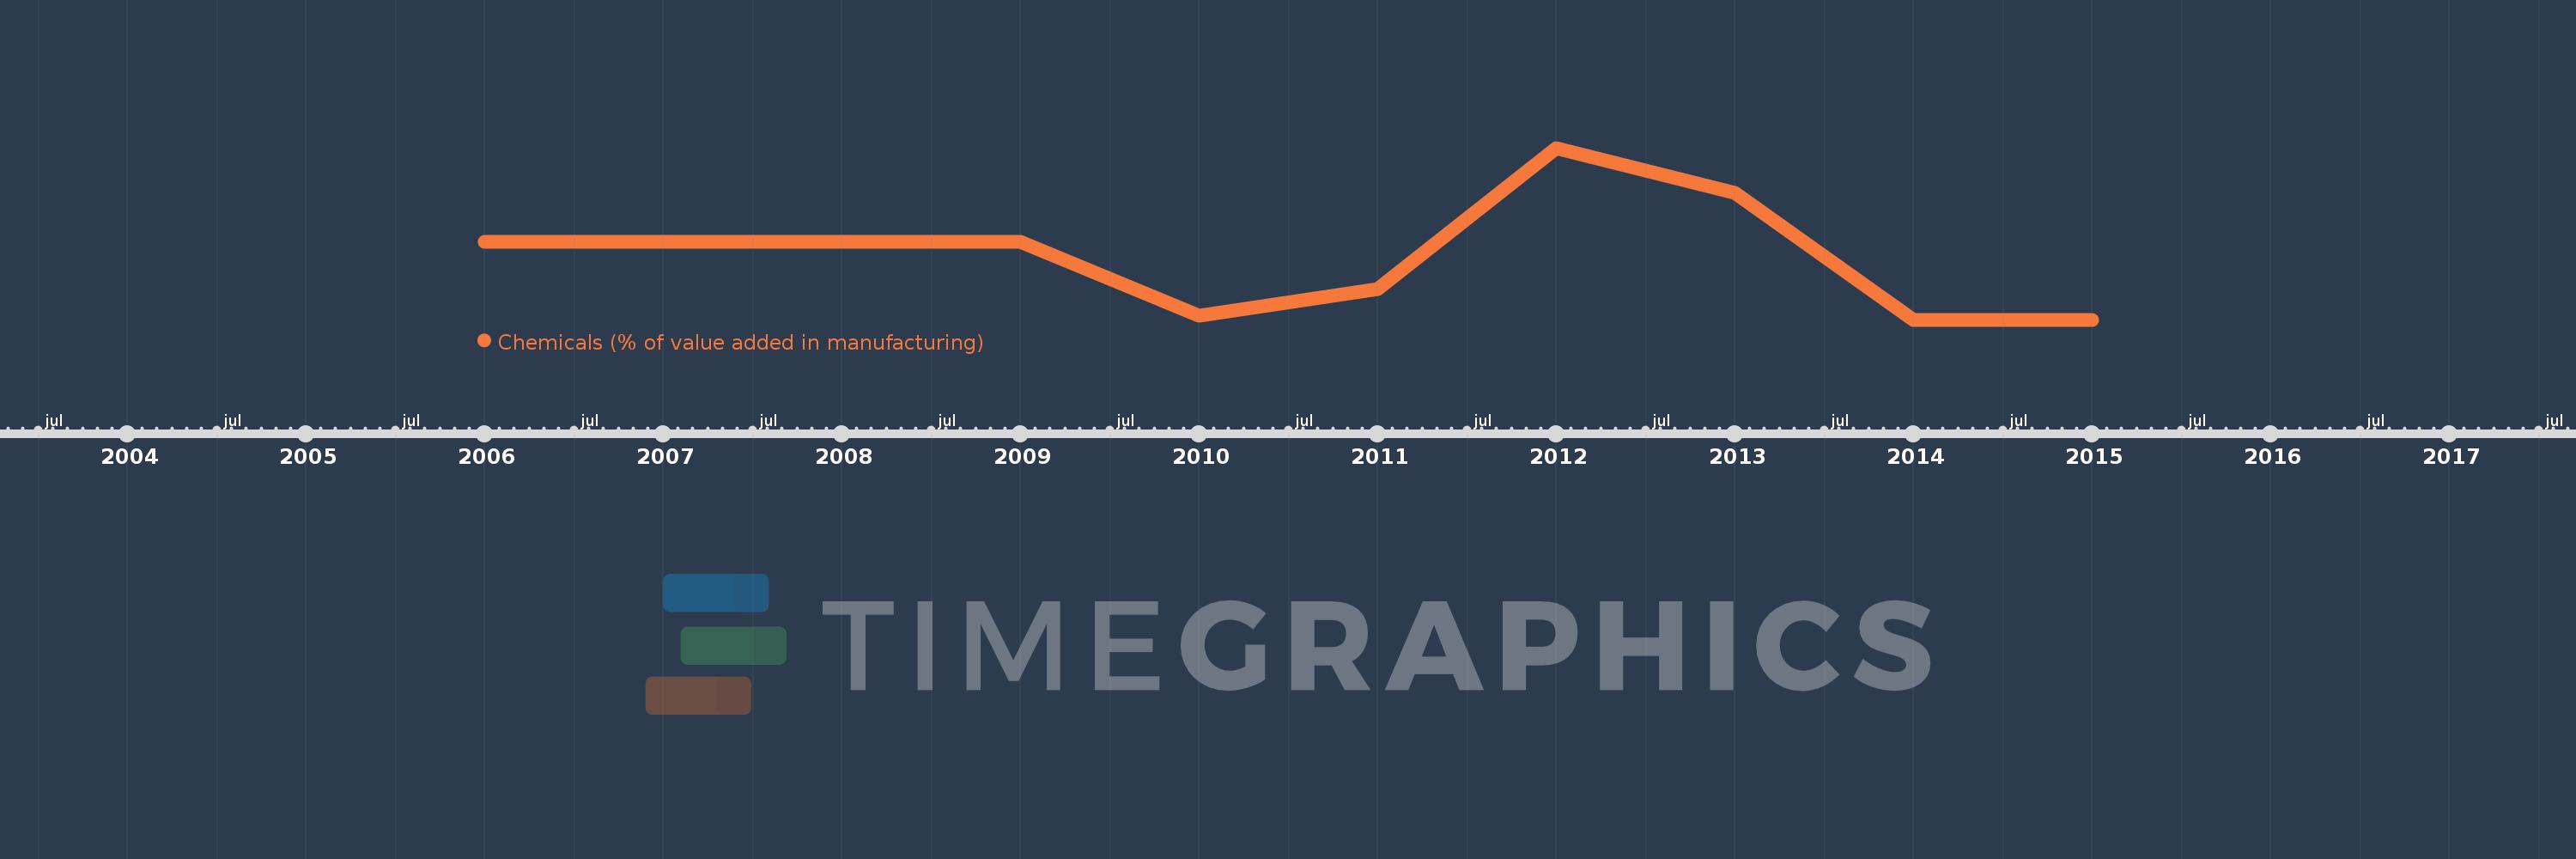
Questa scala temporale mostra un grafico dal 2006 anno al 2015 anno. Belarus. I dati fino ad 2005 anno non disponibili. Il numero di osservazioni attuali secondo i date: 10.
La fonte (nome):
Indicatori dello sviluppo mondiale
La fonte (organizzazione):
United Nations Industrial Development Organization, International Yearbook of Industrial Statistics.
Categorie:
Economy & Growth
sono stati aggiornati
23 apr 2017 anni
Indicatori delle variazioni dei valori per anni
In media:
17.348
Minima:
14.022
1 gen 2014 anni
Massimo:
22.861
1 gen 2012 anni
Alla data di osservazione
Valore
Variazione assoluta
La variazione rispetto al valore precedente
1 gen 2006 anni
18.044
+18.044
0.0%
1 gen 2007 anni
18.044
0.0
0.0%
1 gen 2008 anni
18.044
+0.0
0.0%
1 gen 2009 anni
18.044
0.0
0.0%
1 gen 2010 anni
14.242
-3.802
-21.07%
1 gen 2011 anni
15.617
+1.375
9.65%
1 gen 2012 anni
22.861
+7.244
46.39%
1 gen 2013 anni
20.537
-2.324
-10.16%
1 gen 2014 anni
14.022
-6.515
-31.72%
1 gen 2015 anni
14.022
+0.0
0.0%
Classificazione dei paesi secondo i statistiche attuali per anni