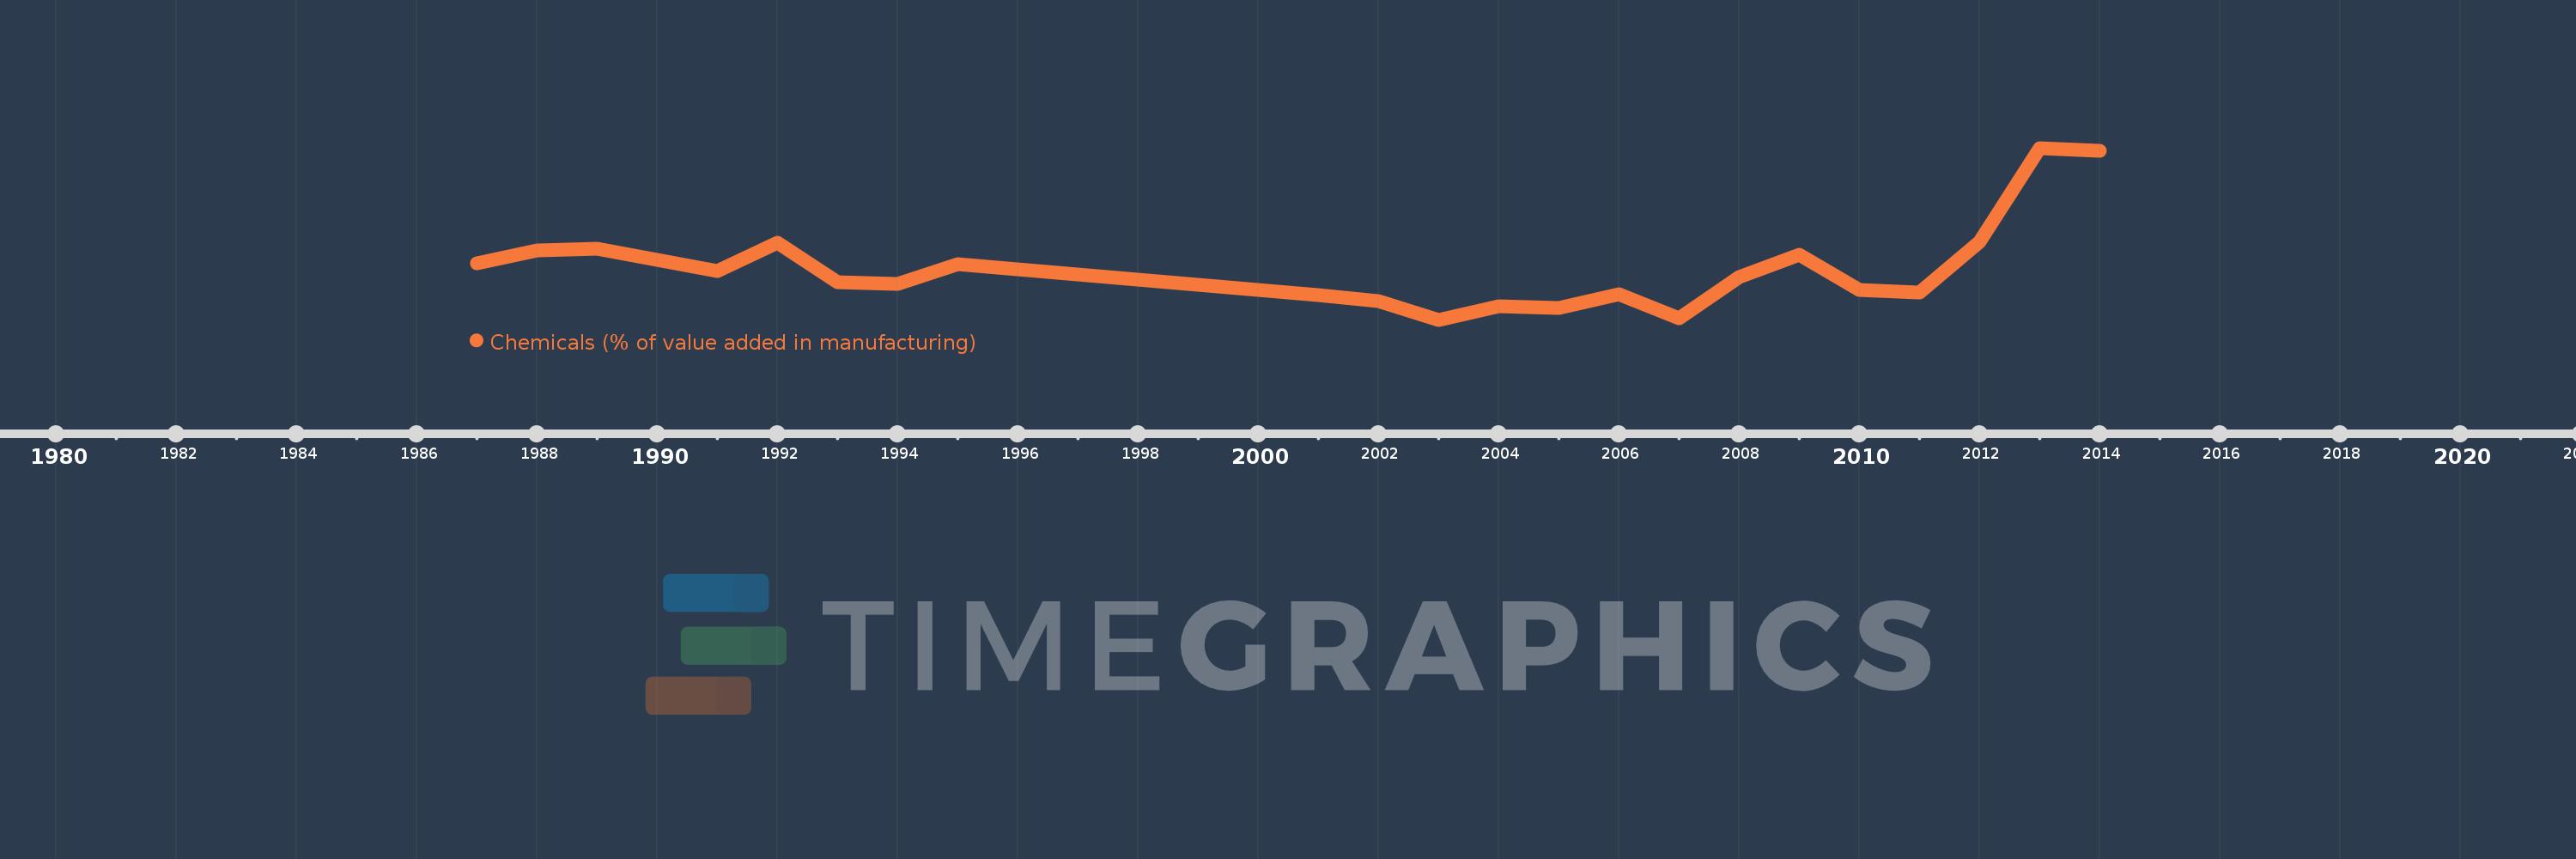
Questa scala temporale mostra un grafico dal 1987 anno al 2014 anno. Qatar. I dati fino ad 1986 anno non disponibili. Il numero di osservazioni attuali secondo i date: 22.
La fonte (nome):
Indicatori dello sviluppo mondiale
La fonte (organizzazione):
United Nations Industrial Development Organization, International Yearbook of Industrial Statistics.
Categorie:
Economy & Growth
sono stati aggiornati
23 apr 2017 anni
Indicatori delle variazioni dei valori per anni
In media:
28.815
Minima:
14.548
1 gen 2003 anni
Massimo:
62.363
1 gen 2013 anni
Alla data di osservazione
Valore
Variazione assoluta
La variazione rispetto al valore precedente
1 gen 1987 anni
30.182
+30.182
0.0%
1 gen 1988 anni
33.841
+3.659
12.12%
1 gen 1989 anni
34.269
+0.428
1.27%
1 gen 1991 anni
28.059
-6.21
-18.12%
1 gen 1992 anni
35.875
+7.816
27.85%
1 gen 1993 anni
24.922
-10.953
-30.53%
1 gen 1994 anni
24.513
-0.409
-1.64%
1 gen 1995 anni
30.078
+5.565
22.7%
1 gen 2001 anni
21.446
-8.632
-28.7%
1 gen 2002 anni
19.711
-1.735
-8.09%
1 gen 2003 anni
14.548
-5.163
-26.19%
1 gen 2004 anni
18.199
+3.651
25.09%
1 gen 2005 anni
17.766
-0.433
-2.38%
1 gen 2006 anni
21.572
+3.806
21.42%
1 gen 2007 anni
14.842
-6.73
-31.2%
1 gen 2008 anni
26.346
+11.504
77.51%
1 gen 2009 anni
32.59
+6.244
23.7%
1 gen 2010 anni
22.87
-9.72
-29.83%
1 gen 2011 anni
22.08
-0.789
-3.45%
1 gen 2012 anni
36.305
+14.225
64.42%
1 gen 2013 anni
62.363
+26.058
71.77%
1 gen 2014 anni
61.56
-0.803
-1.29%
Classificazione dei paesi secondo i statistiche attuali per anni