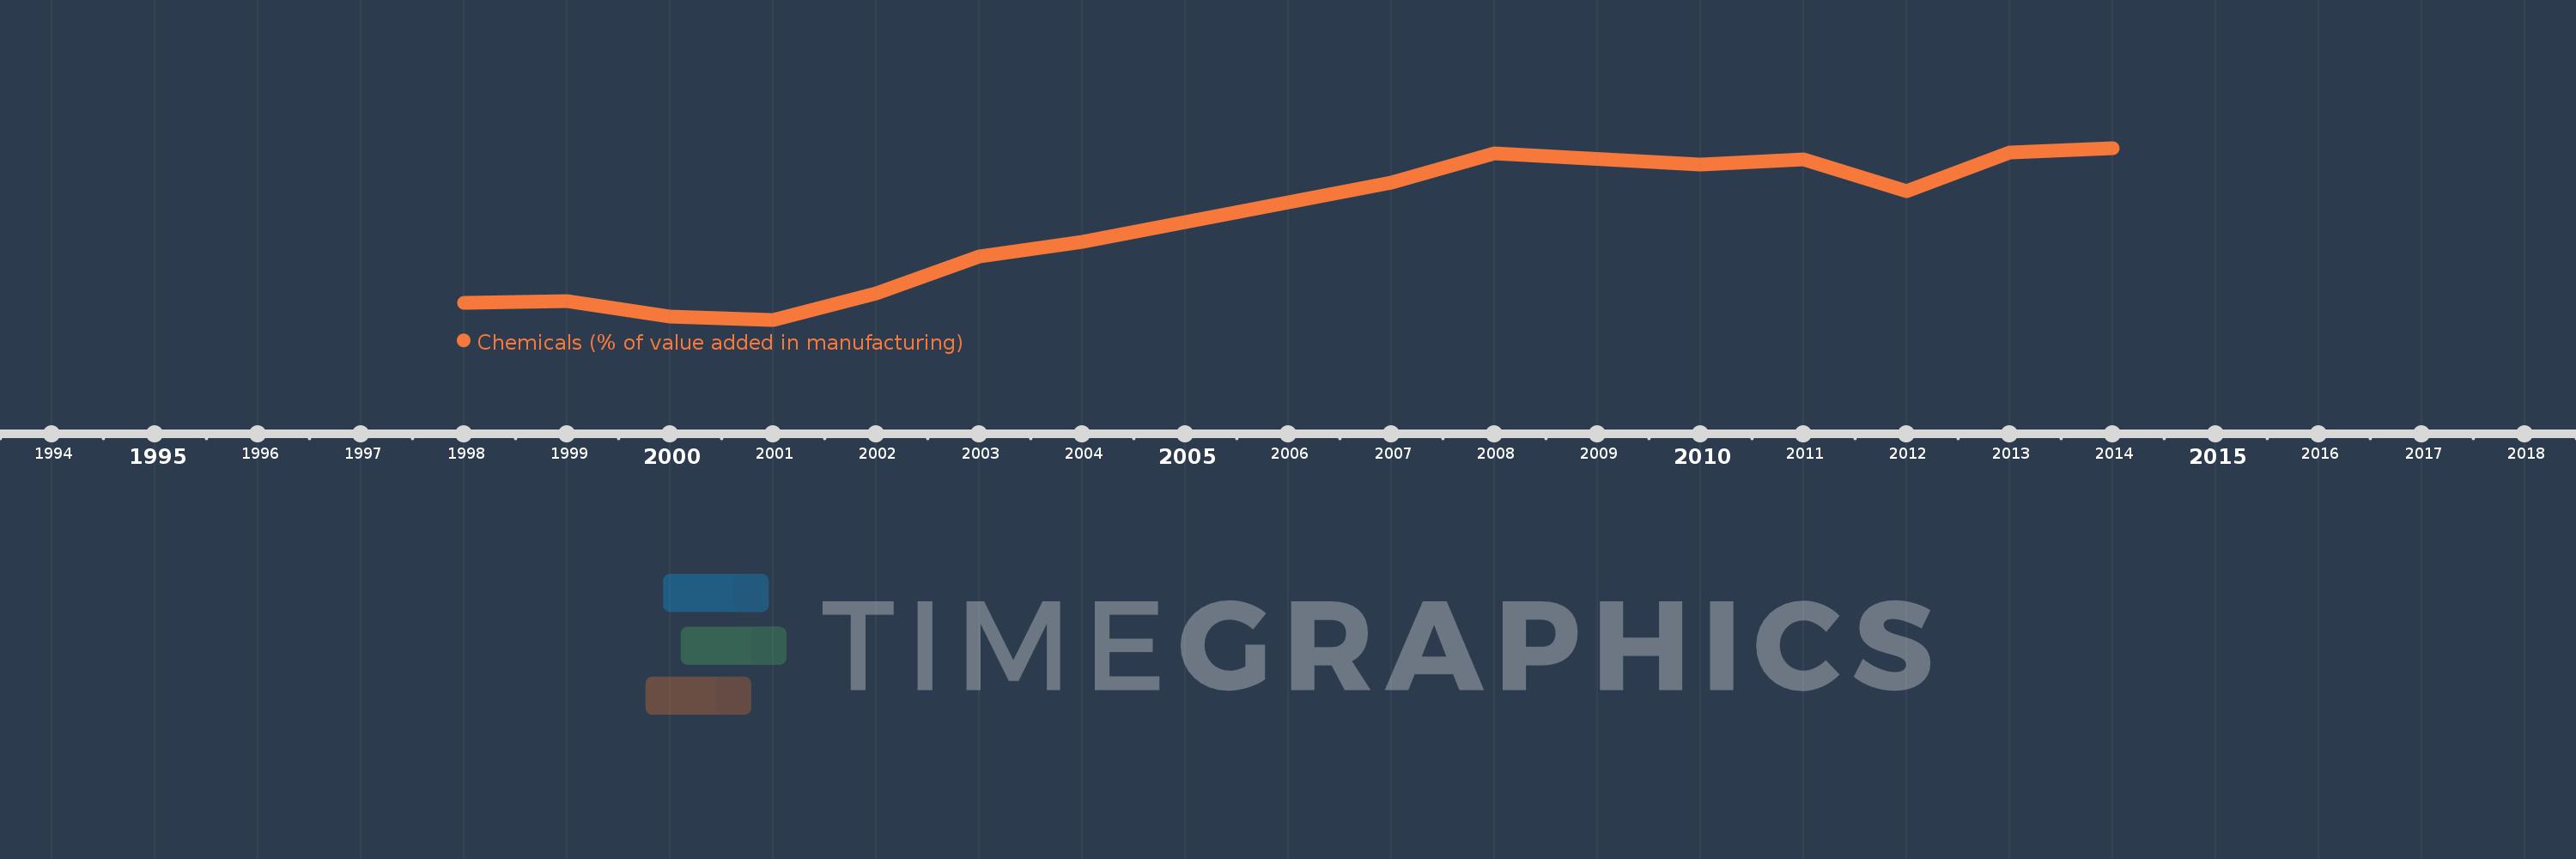
Questa scala temporale mostra un grafico dal 1998 anno al 2014 anno. Switzerland. I dati fino ad 1997 anno non disponibili. Il numero di osservazioni attuali secondo i date: 14.
La fonte (nome):
Indicatori dello sviluppo mondiale
La fonte (organizzazione):
United Nations Industrial Development Organization, International Yearbook of Industrial Statistics.
Categorie:
Economy & Growth
sono stati aggiornati
23 apr 2017 anni
Indicatori delle variazioni dei valori per anni
In media:
20.159
Minima:
15.501
1 gen 2001 anni
Massimo:
24.162
1 gen 2014 anni
Alla data di osservazione
Valore
Variazione assoluta
La variazione rispetto al valore precedente
1 gen 1998 anni
16.361
+16.361
0.0%
1 gen 1999 anni
16.443
+0.082
0.5%
1 gen 2000 anni
15.64
-0.803
-4.88%
1 gen 2001 anni
15.501
-0.139
-0.89%
1 gen 2002 anni
16.834
+1.333
8.6%
1 gen 2003 anni
18.709
+1.875
11.14%
1 gen 2004 anni
19.444
+0.735
3.93%
1 gen 2007 anni
22.421
+2.977
15.31%
1 gen 2008 anni
23.895
+1.475
6.58%
1 gen 2010 anni
23.329
-0.566
-2.37%
1 gen 2011 anni
23.574
+0.245
1.05%
1 gen 2012 anni
21.985
-1.589
-6.74%
1 gen 2013 anni
23.935
+1.95
8.87%
1 gen 2014 anni
24.162
+0.227
0.95%
Classificazione dei paesi secondo i statistiche attuali per anni