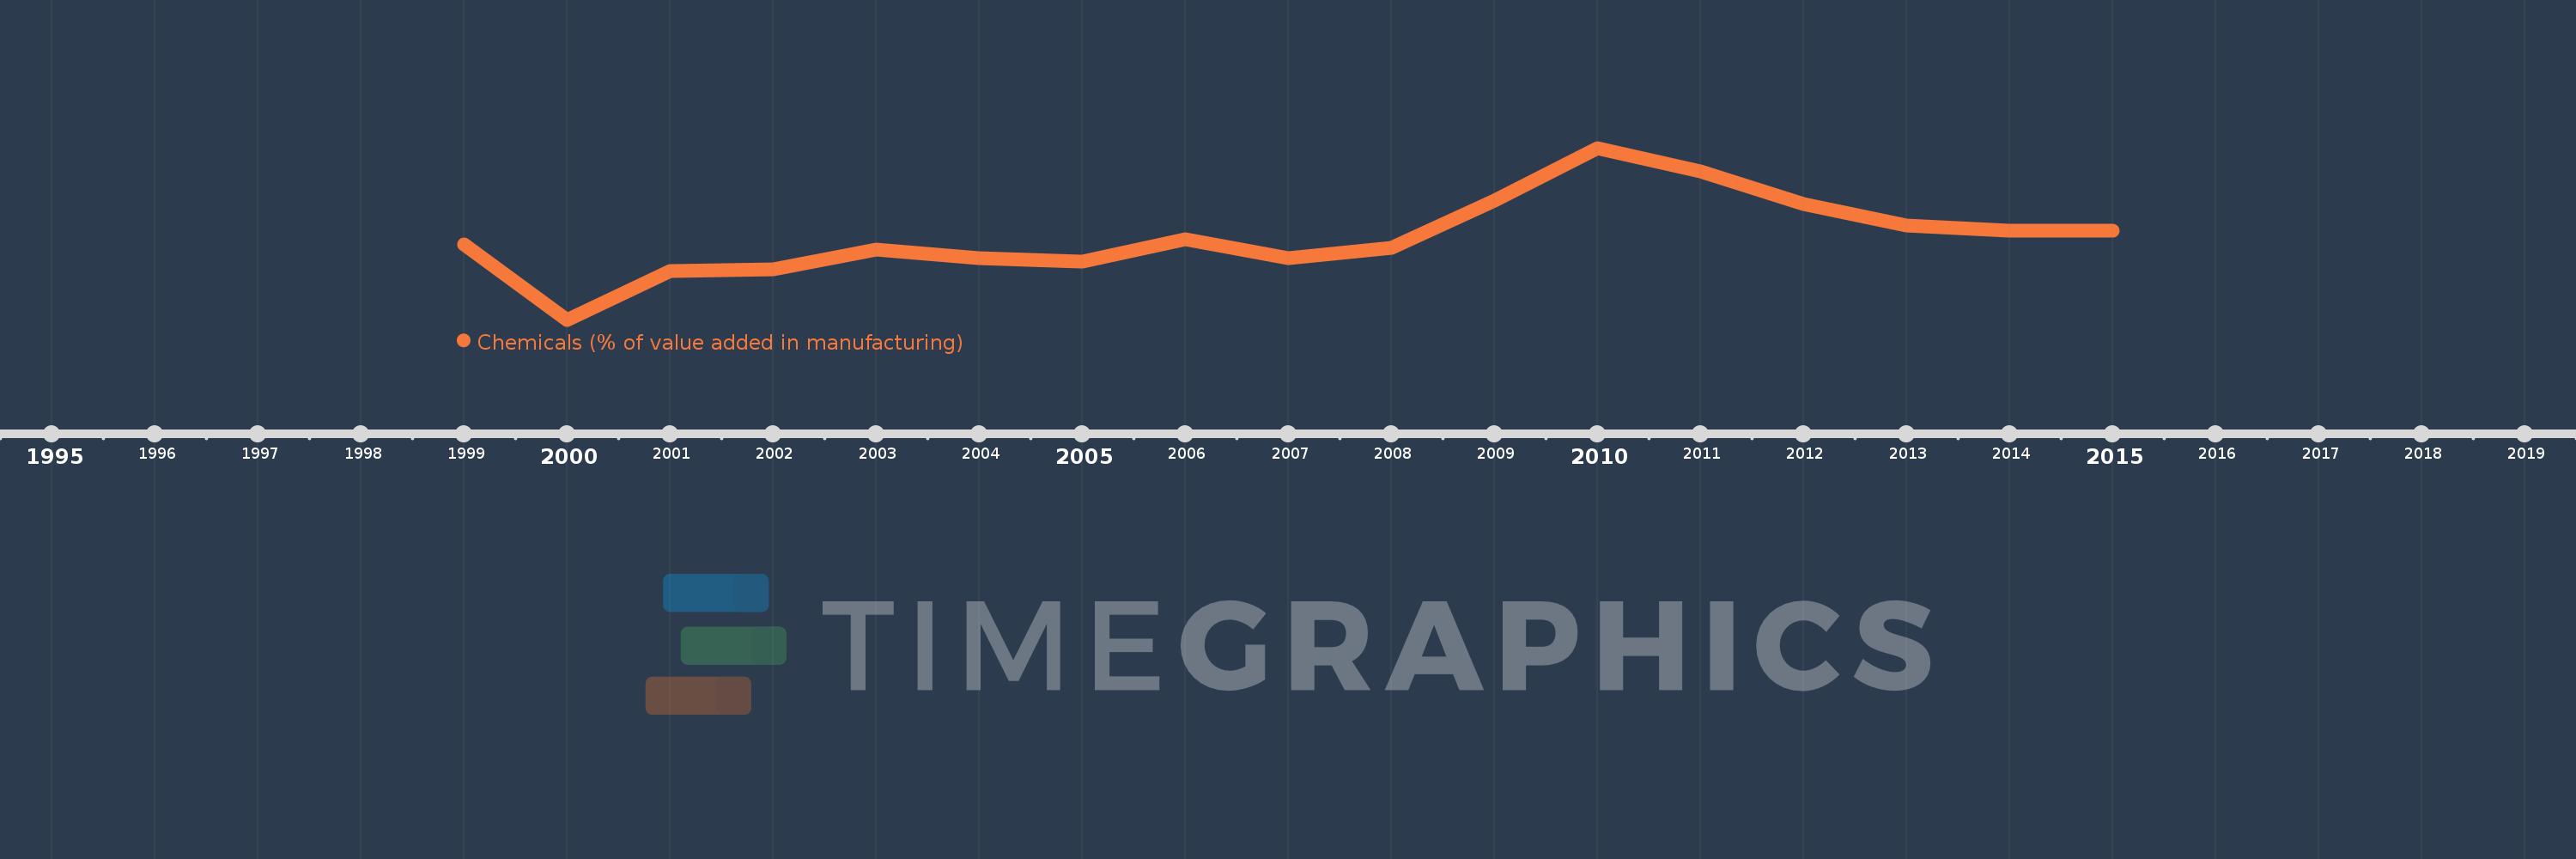
Questa scala temporale mostra un grafico dal 1999 anno al 2015 anno. Germany. I dati fino ad 1998 anno non disponibili. Il numero di osservazioni attuali secondo i date: 17.
La fonte (nome):
Indicatori dello sviluppo mondiale
La fonte (organizzazione):
United Nations Industrial Development Organization, International Yearbook of Industrial Statistics.
Categorie:
Economy & Growth
sono stati aggiornati
23 apr 2017 anni
Indicatori delle variazioni dei valori per anni
In media:
10.333
Minima:
8.962
1 gen 2000 anni
Massimo:
11.811
1 gen 2010 anni
Alla data di osservazione
Valore
Variazione assoluta
La variazione rispetto al valore precedente
1 gen 1999 anni
10.215
+10.215
0.0%
1 gen 2000 anni
8.962
-1.253
-12.26%
1 gen 2001 anni
9.768
+0.806
8.99%
1 gen 2002 anni
9.794
+0.026
0.26%
1 gen 2003 anni
10.122
+0.328
3.35%
1 gen 2004 anni
9.98
-0.142
-1.4%
1 gen 2005 anni
9.923
-0.056
-0.57%
1 gen 2006 anni
10.299
+0.376
3.79%
1 gen 2007 anni
9.983
-0.317
-3.08%
1 gen 2008 anni
10.161
+0.179
1.79%
1 gen 2009 anni
10.939
+0.777
7.65%
1 gen 2010 anni
11.811
+0.872
7.97%
1 gen 2011 anni
11.428
-0.383
-3.24%
1 gen 2012 anni
10.882
-0.546
-4.78%
1 gen 2013 anni
10.519
-0.363
-3.33%
1 gen 2014 anni
10.439
-0.08
-0.76%
1 gen 2015 anni
10.439
0.0
0.0%
Classificazione dei paesi secondo i statistiche attuali per anni