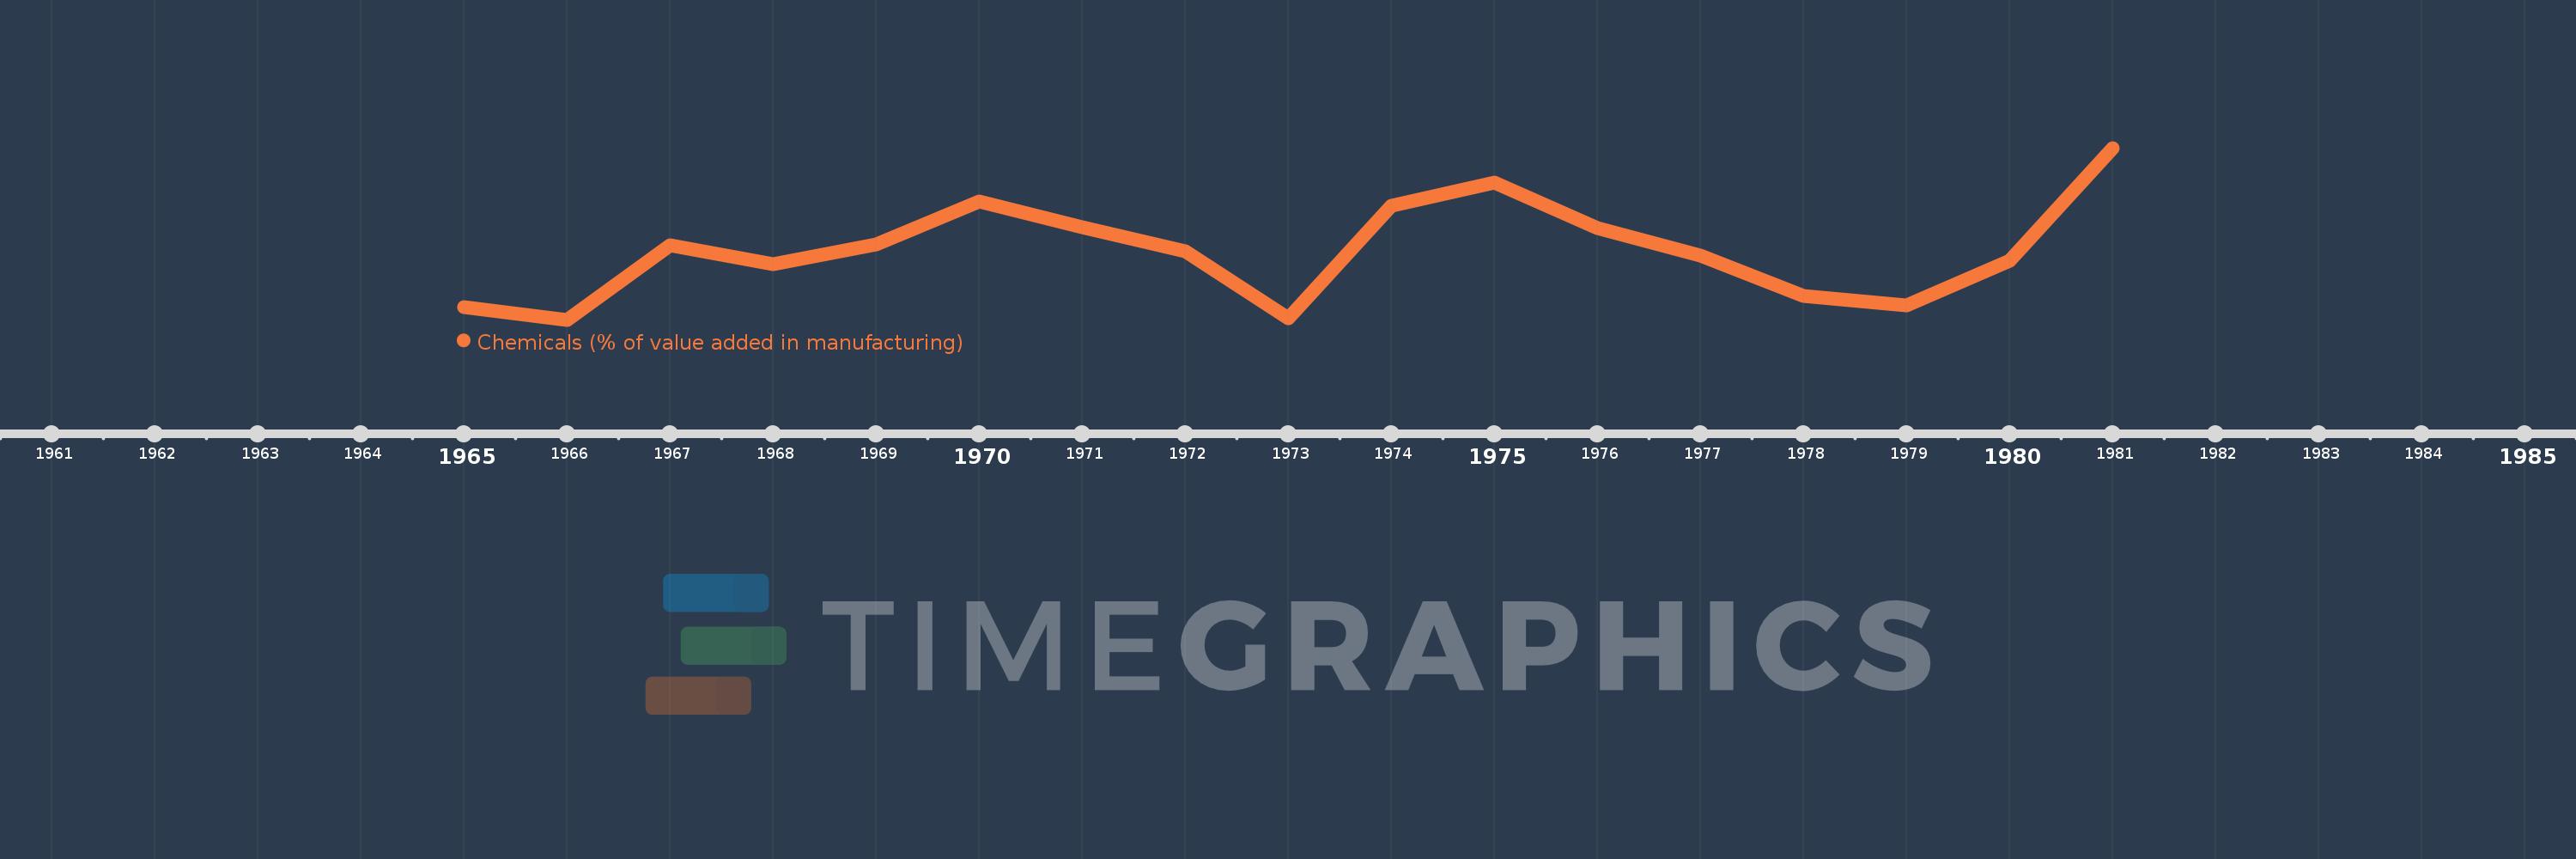
Questa scala temporale mostra un grafico dal 1965 anno al 1981 anno. Libya. I dati fino ad 1964 anno non disponibili. Il numero di osservazioni attuali secondo i date: 17.
La fonte (nome):
Indicatori dello sviluppo mondiale
La fonte (organizzazione):
United Nations Industrial Development Organization, International Yearbook of Industrial Statistics.
Categorie:
Economy & Growth
sono stati aggiornati
23 apr 2017 anni
Indicatori delle variazioni dei valori per anni
In media:
10.499
Minima:
6.755
1 gen 1966 anni
Massimo:
16.056
1 gen 1981 anni
Alla data di osservazione
Valore
Variazione assoluta
La variazione rispetto al valore precedente
1 gen 1965 anni
7.453
+7.453
0.0%
1 gen 1966 anni
6.755
-0.699
-9.37%
1 gen 1967 anni
10.785
+4.03
59.66%
1 gen 1968 anni
9.752
-1.033
-9.58%
1 gen 1969 anni
10.845
+1.094
11.22%
1 gen 1970 anni
13.144
+2.298
21.19%
1 gen 1971 anni
11.785
-1.359
-10.34%
1 gen 1972 anni
10.464
-1.321
-11.21%
1 gen 1973 anni
6.839
-3.626
-34.65%
1 gen 1974 anni
12.947
+6.108
89.32%
1 gen 1975 anni
14.167
+1.22
9.42%
1 gen 1976 anni
11.74
-2.427
-17.13%
1 gen 1977 anni
10.241
-1.499
-12.77%
1 gen 1978 anni
8.053
-2.188
-21.36%
1 gen 1979 anni
7.52
-0.533
-6.62%
1 gen 1980 anni
9.94
+2.42
32.18%
1 gen 1981 anni
16.056
+6.116
61.52%
Classificazione dei paesi secondo i statistiche attuali per anni