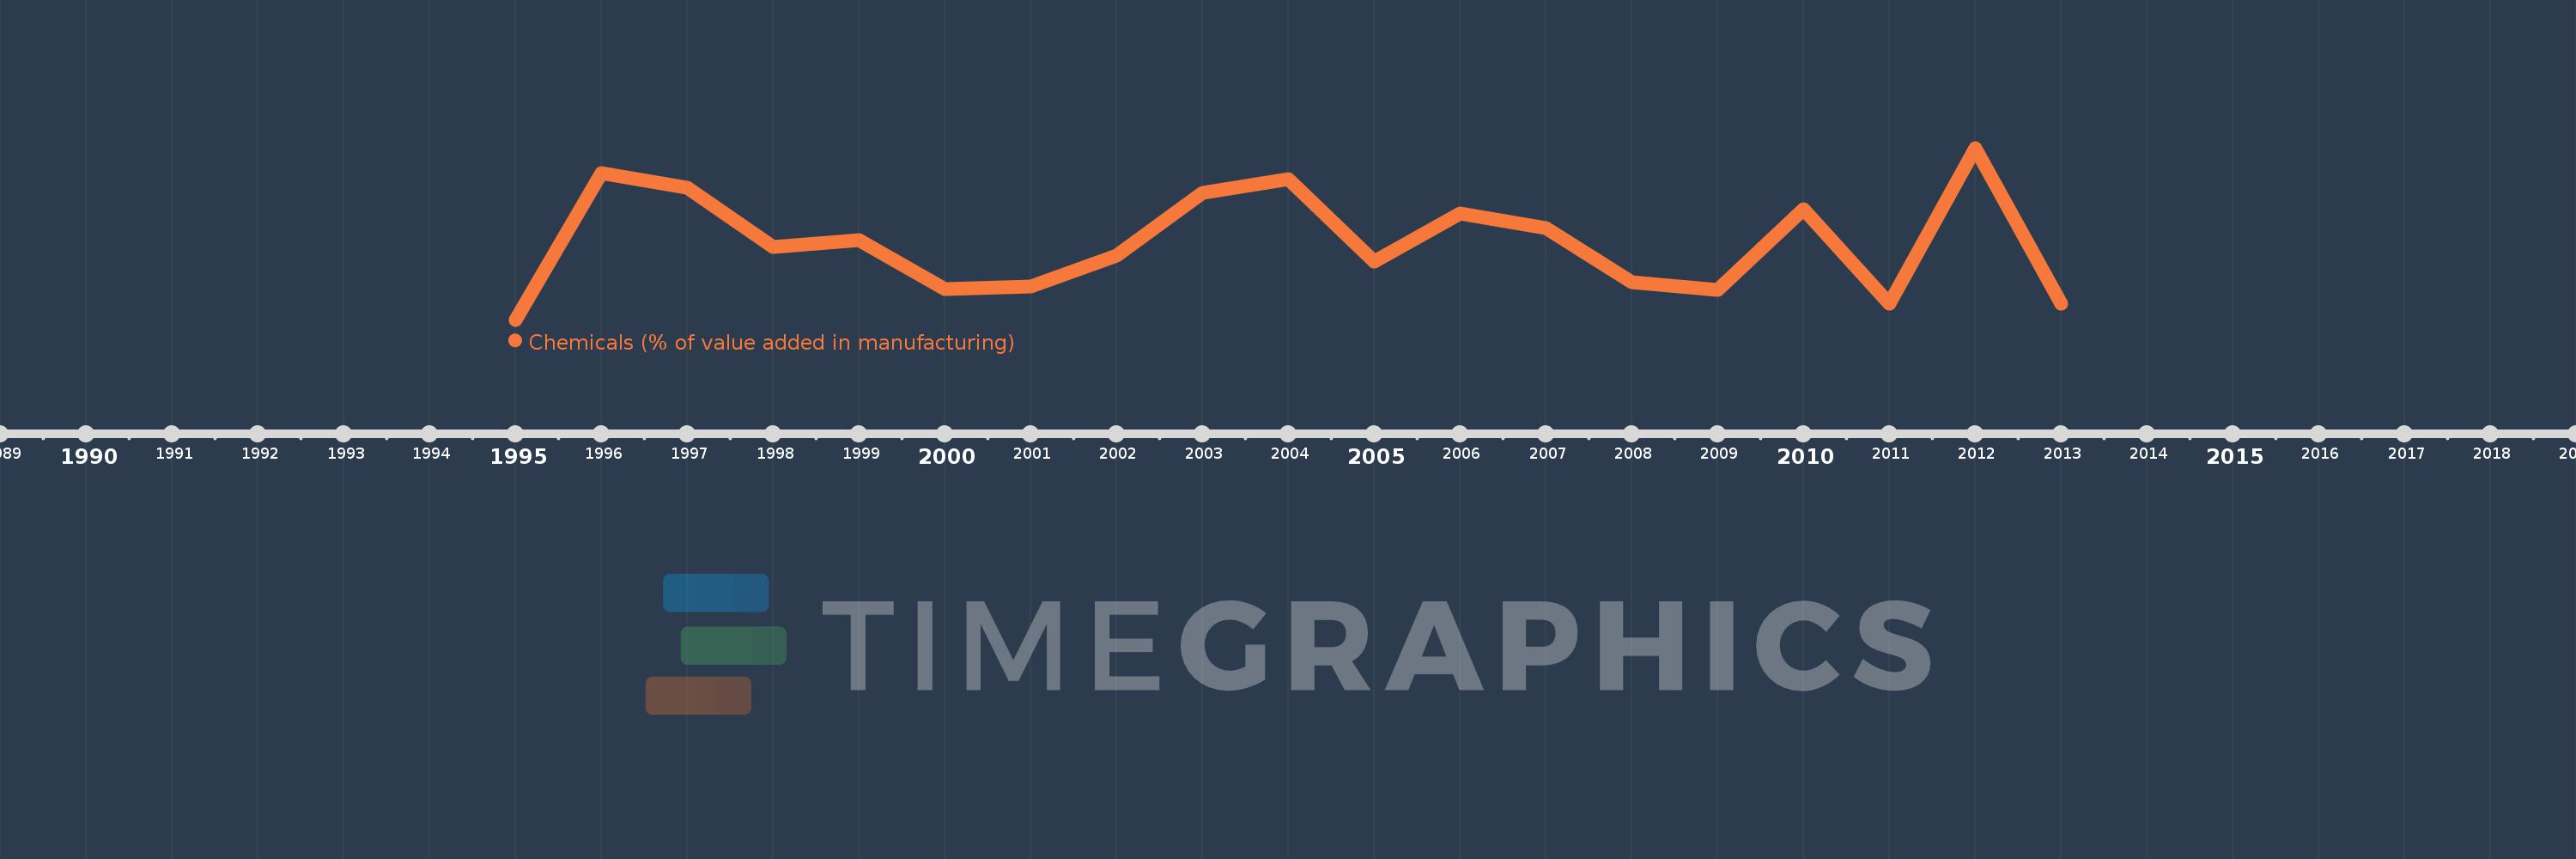
Questa scala temporale mostra un grafico dal 1995 anno al 2013 anno. West Bank and Gaza. I dati fino ad 1994 anno non disponibili. Il numero di osservazioni attuali secondo i date: 19.
La fonte (nome):
Indicatori dello sviluppo mondiale
La fonte (organizzazione):
United Nations Industrial Development Organization, International Yearbook of Industrial Statistics.
Categorie:
Economy & Growth
sono stati aggiornati
23 apr 2017 anni
Indicatori delle variazioni dei valori per anni
In media:
5.391
Minima:
3.43
1 gen 1995 anni
Massimo:
7.8
1 gen 2012 anni
Alla data di osservazione
Valore
Variazione assoluta
La variazione rispetto al valore precedente
1 gen 1995 anni
3.43
+3.43
0.0%
1 gen 1996 anni
7.162
+3.731
108.77%
1 gen 1997 anni
6.796
-0.365
-5.1%
1 gen 1998 anni
5.275
-1.521
-22.39%
1 gen 1999 anni
5.452
+0.177
3.36%
1 gen 2000 anni
4.216
-1.237
-22.68%
1 gen 2001 anni
4.282
+0.066
1.57%
1 gen 2002 anni
5.07
+0.788
18.4%
1 gen 2003 anni
6.663
+1.593
31.42%
1 gen 2004 anni
7.002
+0.339
5.09%
1 gen 2005 anni
4.909
-2.092
-29.88%
1 gen 2006 anni
6.127
+1.217
24.8%
1 gen 2007 anni
5.753
-0.374
-6.11%
1 gen 2008 anni
4.392
-1.36
-23.65%
1 gen 2009 anni
4.19
-0.203
-4.61%
1 gen 2010 anni
6.232
+2.042
48.75%
1 gen 2011 anni
3.839
-2.393
-38.39%
1 gen 2012 anni
7.8
+3.961
103.17%
1 gen 2013 anni
3.847
-3.953
-50.68%
Classificazione dei paesi secondo i statistiche attuali per anni