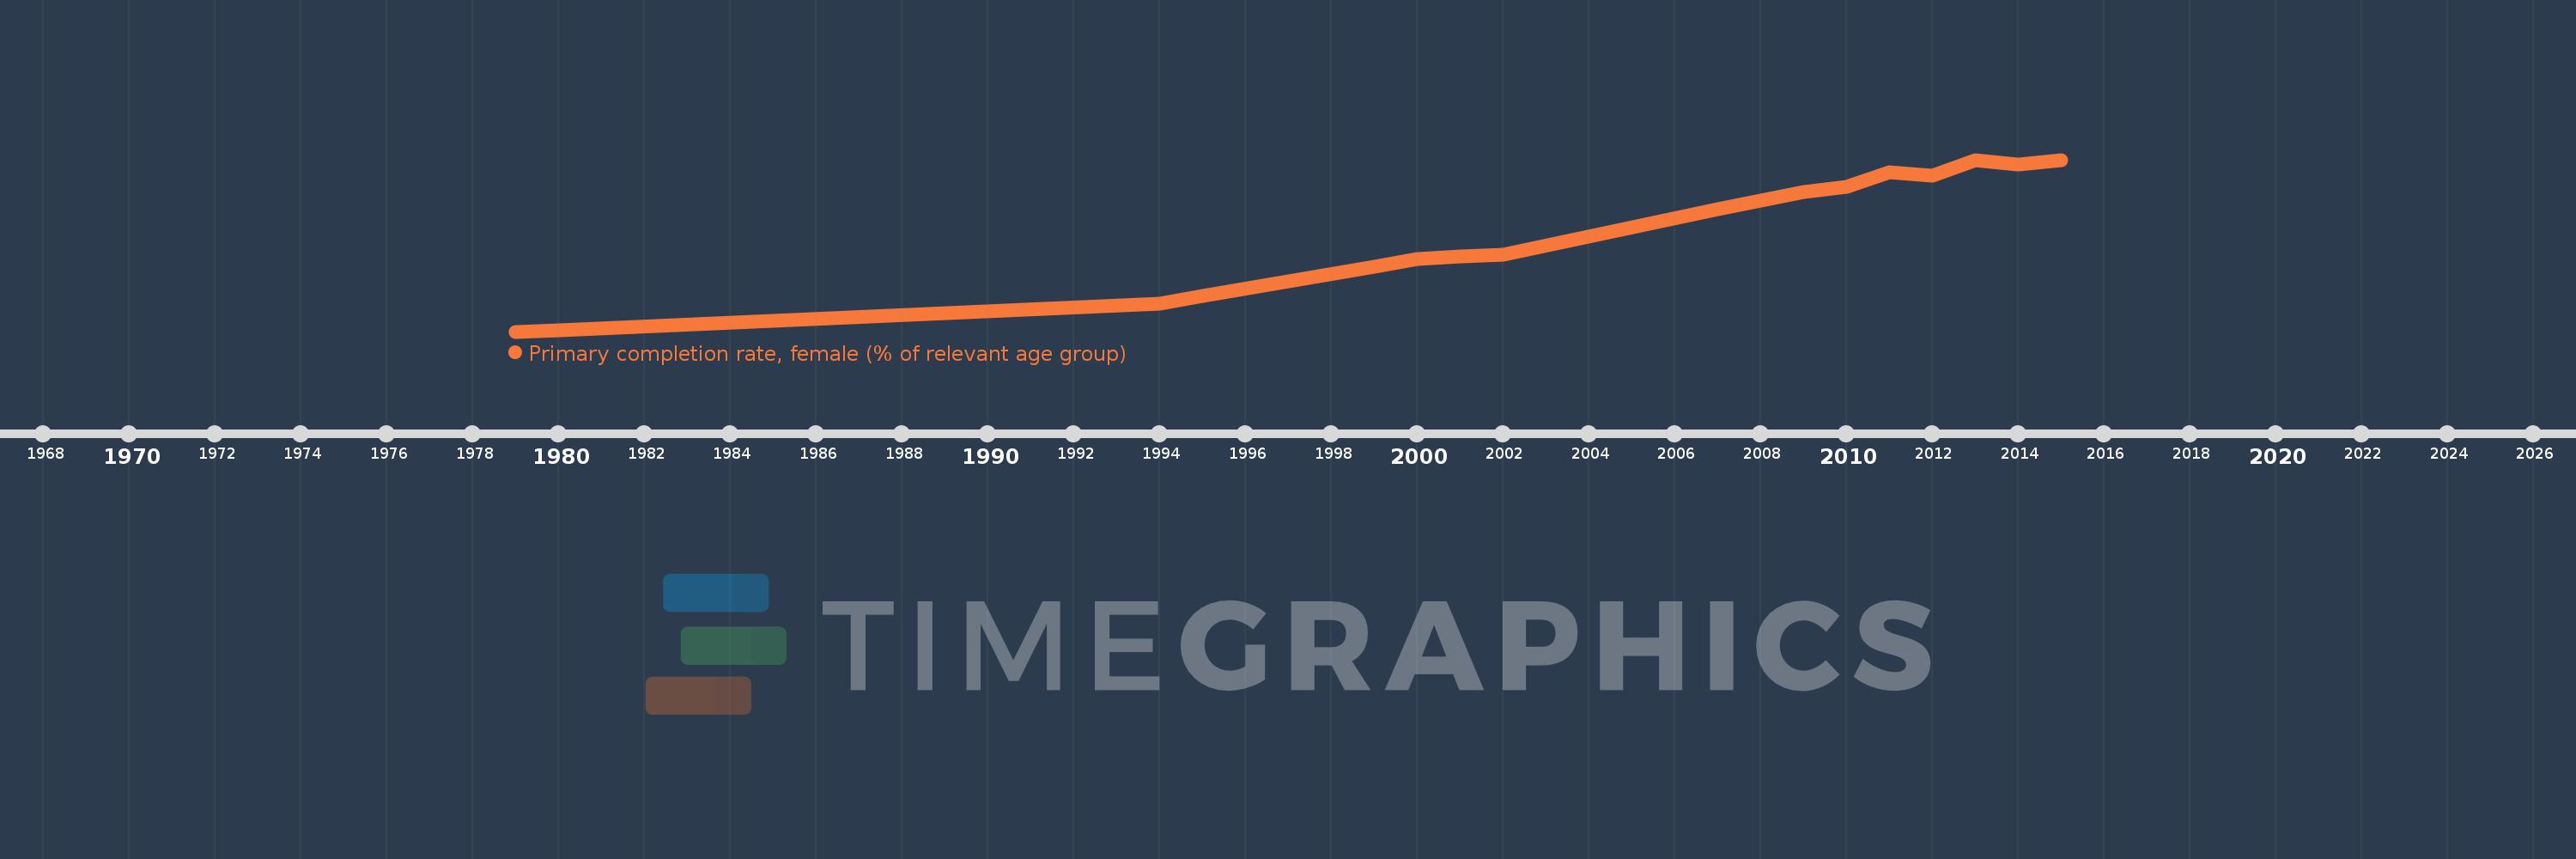
Questa scala temporale mostra un grafico dal 1979 anno al 2015 anno. Bhutan. I dati fino ad 1978 anno non disponibili. Il numero di osservazioni attuali secondo i date: 16.
La fonte (nome):
Indicatori dello sviluppo mondiale
La fonte (organizzazione):
United Nations Educational, Scientific, and Cultural Organization (UNESCO) Institute for Statistics.
Categorie:
Education, Gender
sono stati aggiornati
23 apr 2017 anni
Indicatori delle variazioni dei valori per anni
In media:
61.176
Minima:
4.444
1 gen 1979 anni
Massimo:
102.777
1 gen 2015 anni
Alla data di osservazione
Valore
Variazione assoluta
La variazione rispetto al valore precedente
1 gen 1979 anni
4.444
+4.444
0.0%
1 gen 1980 anni
5.049
+0.605
13.61%
1 gen 1994 anni
20.182
+15.133
299.71%
1 gen 1995 anni
24.988
+4.806
23.81%
1 gen 1999 anni
41.514
+16.526
66.13%
1 gen 2000 anni
45.889
+4.375
10.54%
1 gen 2001 anni
47.33
+1.441
3.14%
1 gen 2002 anni
48.4
+1.07
2.26%
1 gen 2007 anni
74.401
+26.002
53.72%
1 gen 2009 anni
84.383
+9.982
13.42%
1 gen 2010 anni
87.317
+2.933
3.48%
1 gen 2011 anni
95.6
+8.284
9.49%
1 gen 2012 anni
93.889
-1.711
-1.79%
1 gen 2013 anni
102.674
+8.784
9.36%
1 gen 2014 anni
99.972
-2.702
-2.63%
1 gen 2015 anni
102.777
+2.805
2.81%
Classificazione dei paesi secondo i statistiche attuali per anni