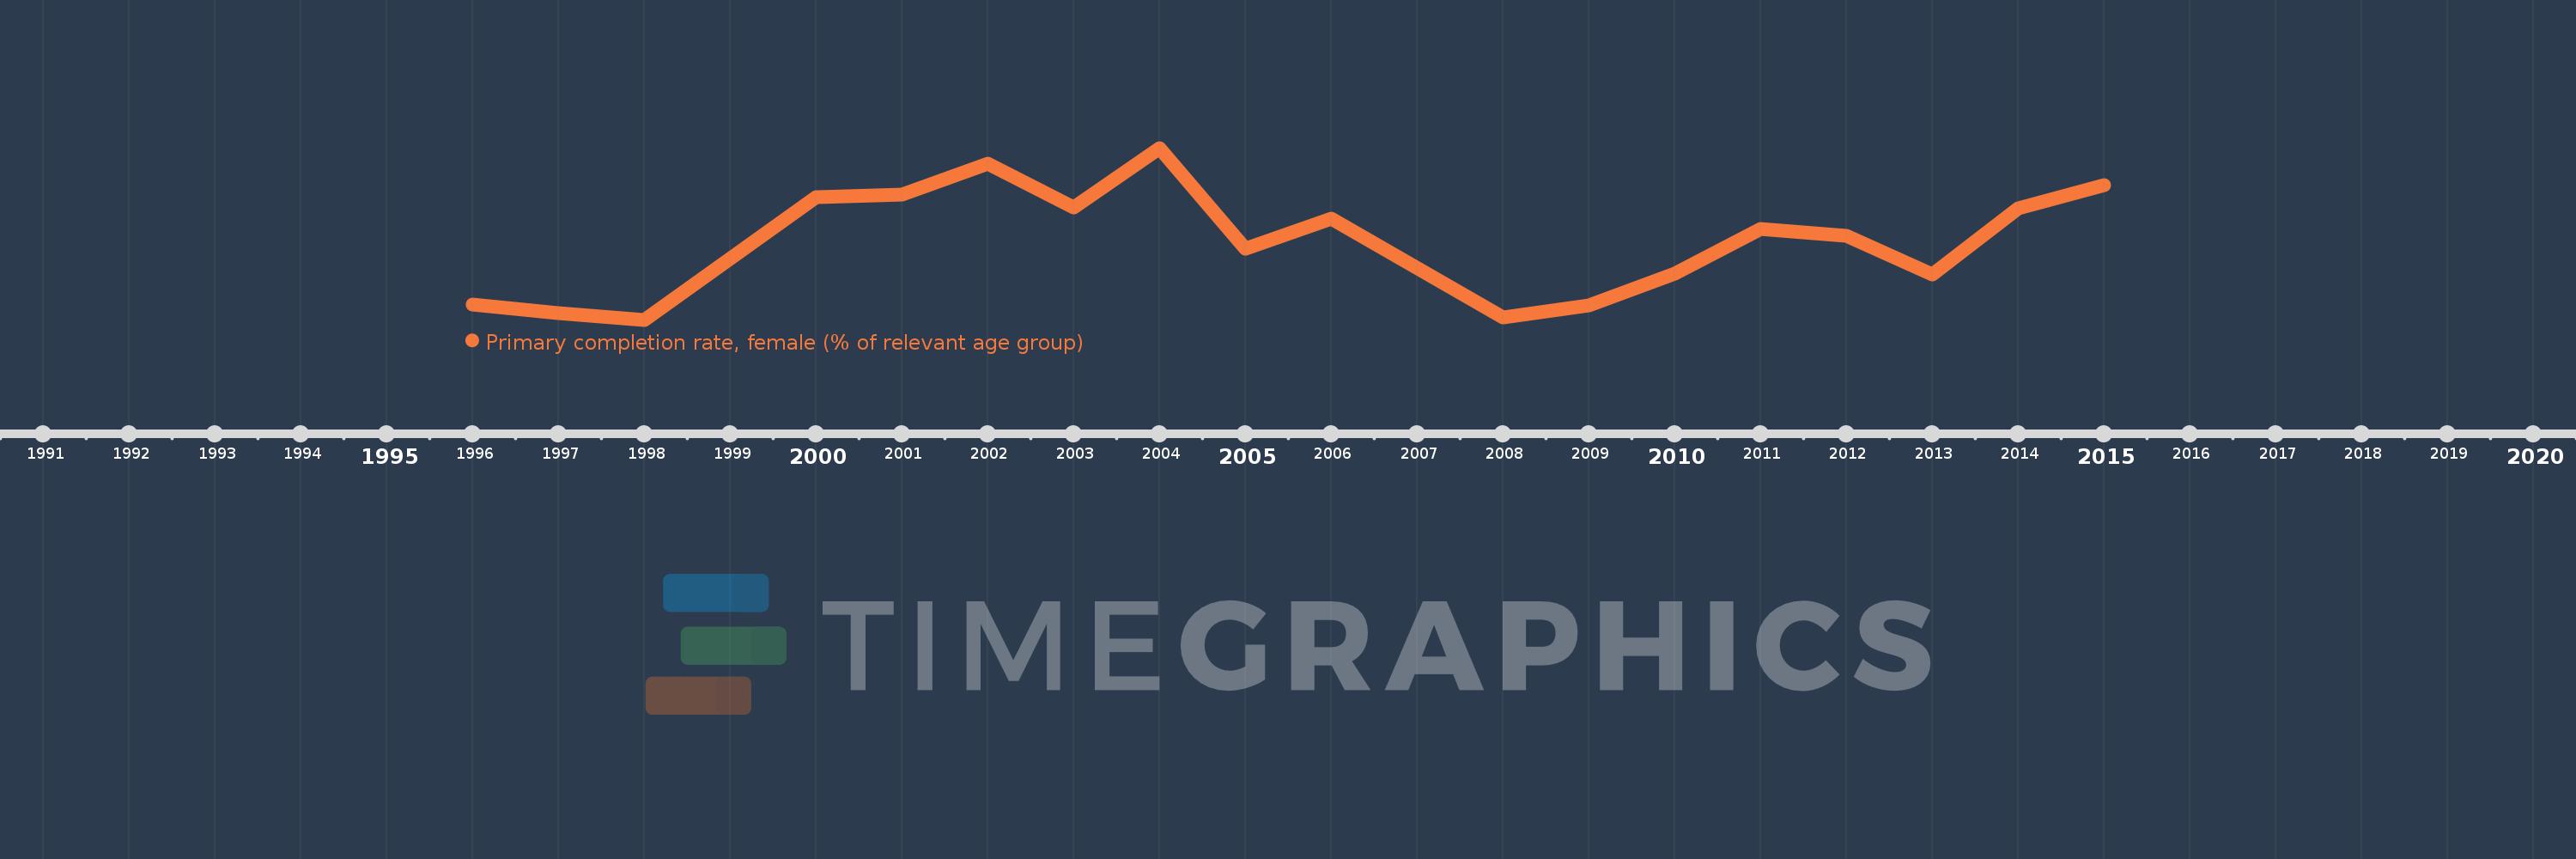
Questa scala temporale mostra un grafico dal 1996 anno al 2015 anno. West Bank and Gaza. I dati fino ad 1995 anno non disponibili. Il numero di osservazioni attuali secondo i date: 18.
La fonte (nome):
Indicatori dello sviluppo mondiale
La fonte (organizzazione):
United Nations Educational, Scientific, and Cultural Organization (UNESCO) Institute for Statistics.
Categorie:
Education, Gender
sono stati aggiornati
23 apr 2017 anni
Indicatori delle variazioni dei valori per anni
In media:
91.233
Minima:
86.039
1 gen 1998 anni
Massimo:
97.434
1 gen 2004 anni
Alla data di osservazione
Valore
Variazione assoluta
La variazione rispetto al valore precedente
1 gen 1996 anni
87.047
+87.047
0.0%
1 gen 1997 anni
86.468
-0.579
-0.67%
1 gen 1998 anni
86.039
-0.429
-0.5%
1 gen 2000 anni
94.151
+8.112
9.43%
1 gen 2001 anni
94.356
+0.205
0.22%
1 gen 2002 anni
96.401
+2.045
2.17%
1 gen 2003 anni
93.497
-2.904
-3.01%
1 gen 2004 anni
97.434
+3.936
4.21%
1 gen 2005 anni
90.758
-6.676
-6.85%
1 gen 2006 anni
92.761
+2.004
2.21%
1 gen 2008 anni
86.183
-6.579
-7.09%
1 gen 2009 anni
86.963
+0.781
0.91%
1 gen 2010 anni
89.112
+2.149
2.47%
1 gen 2011 anni
92.037
+2.925
3.28%
1 gen 2012 anni
91.578
-0.459
-0.5%
1 gen 2013 anni
89.037
-2.541
-2.77%
1 gen 2014 anni
93.42
+4.382
4.92%
1 gen 2015 anni
94.956
+1.536
1.64%
Classificazione dei paesi secondo i statistiche attuali per anni