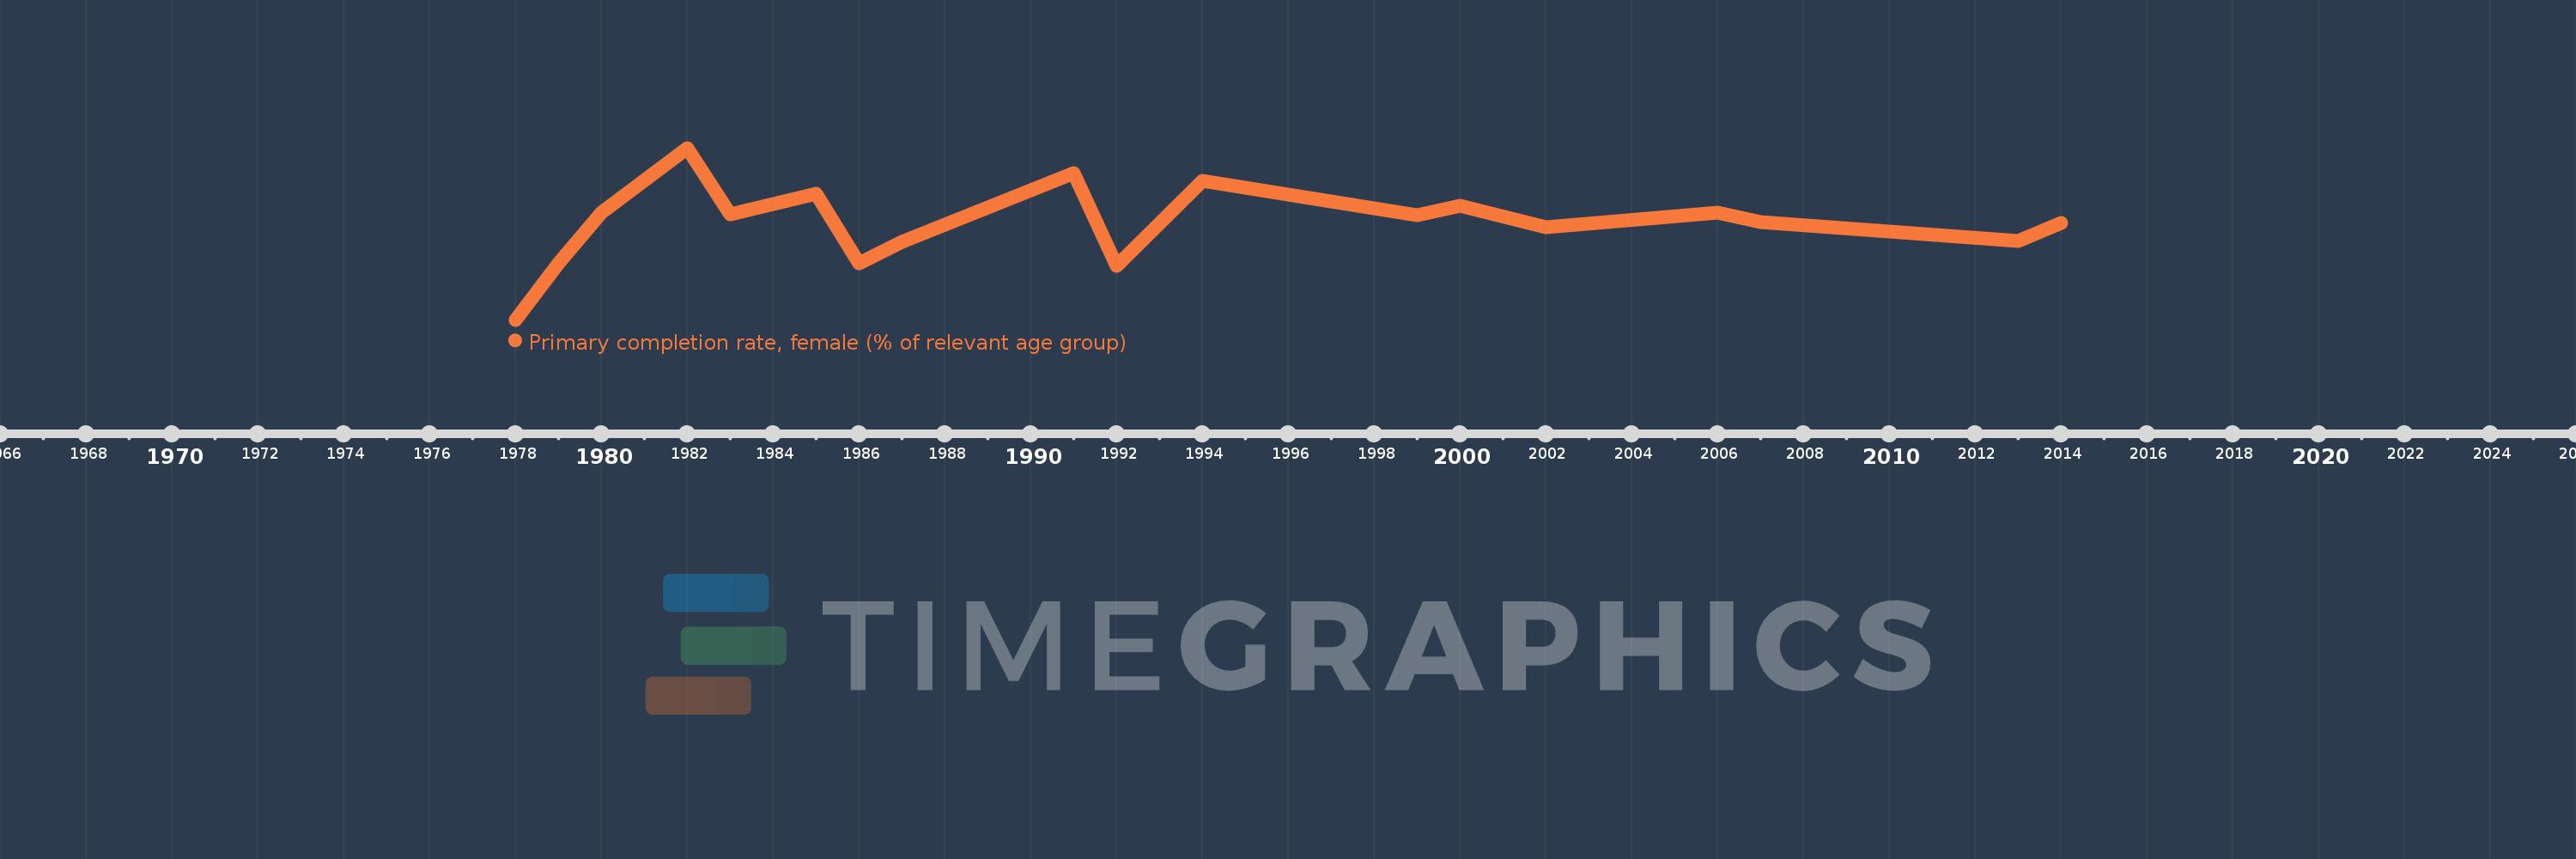
Questa scala temporale mostra un grafico dal 1978 anno al 2014 anno. Tonga. I dati fino ad 1977 anno non disponibili. Il numero di osservazioni attuali secondo i date: 18.
La fonte (nome):
Indicatori dello sviluppo mondiale
La fonte (organizzazione):
United Nations Educational, Scientific, and Cultural Organization (UNESCO) Institute for Statistics.
Categorie:
Education, Gender
sono stati aggiornati
23 apr 2017 anni
Indicatori delle variazioni dei valori per anni
In media:
106.173
Minima:
79.985
1 gen 1978 anni
Massimo:
126.762
1 gen 1982 anni
Alla data di osservazione
Valore
Variazione assoluta
La variazione rispetto al valore precedente
1 gen 1978 anni
79.985
+79.985
0.0%
1 gen 1979 anni
95.28
+15.295
19.12%
1 gen 1980 anni
109.044
+13.764
14.45%
1 gen 1982 anni
126.762
+17.717
16.25%
1 gen 1983 anni
108.602
-18.16
-14.33%
1 gen 1985 anni
114.222
+5.62
5.17%
1 gen 1986 anni
95.326
-18.896
-16.54%
1 gen 1987 anni
101.171
+5.845
6.13%
1 gen 1991 anni
119.947
+18.776
18.56%
1 gen 1992 anni
94.62
-25.327
-21.12%
1 gen 1994 anni
117.848
+23.228
24.55%
1 gen 1999 anni
108.491
-9.358
-7.94%
1 gen 2000 anni
110.935
+2.444
2.25%
1 gen 2002 anni
105.222
-5.713
-5.15%
1 gen 2006 anni
109.267
+4.045
3.84%
1 gen 2007 anni
106.588
-2.679
-2.45%
1 gen 2013 anni
101.423
-5.165
-4.85%
1 gen 2014 anni
106.374
+4.952
4.88%
Classificazione dei paesi secondo i statistiche attuali per anni