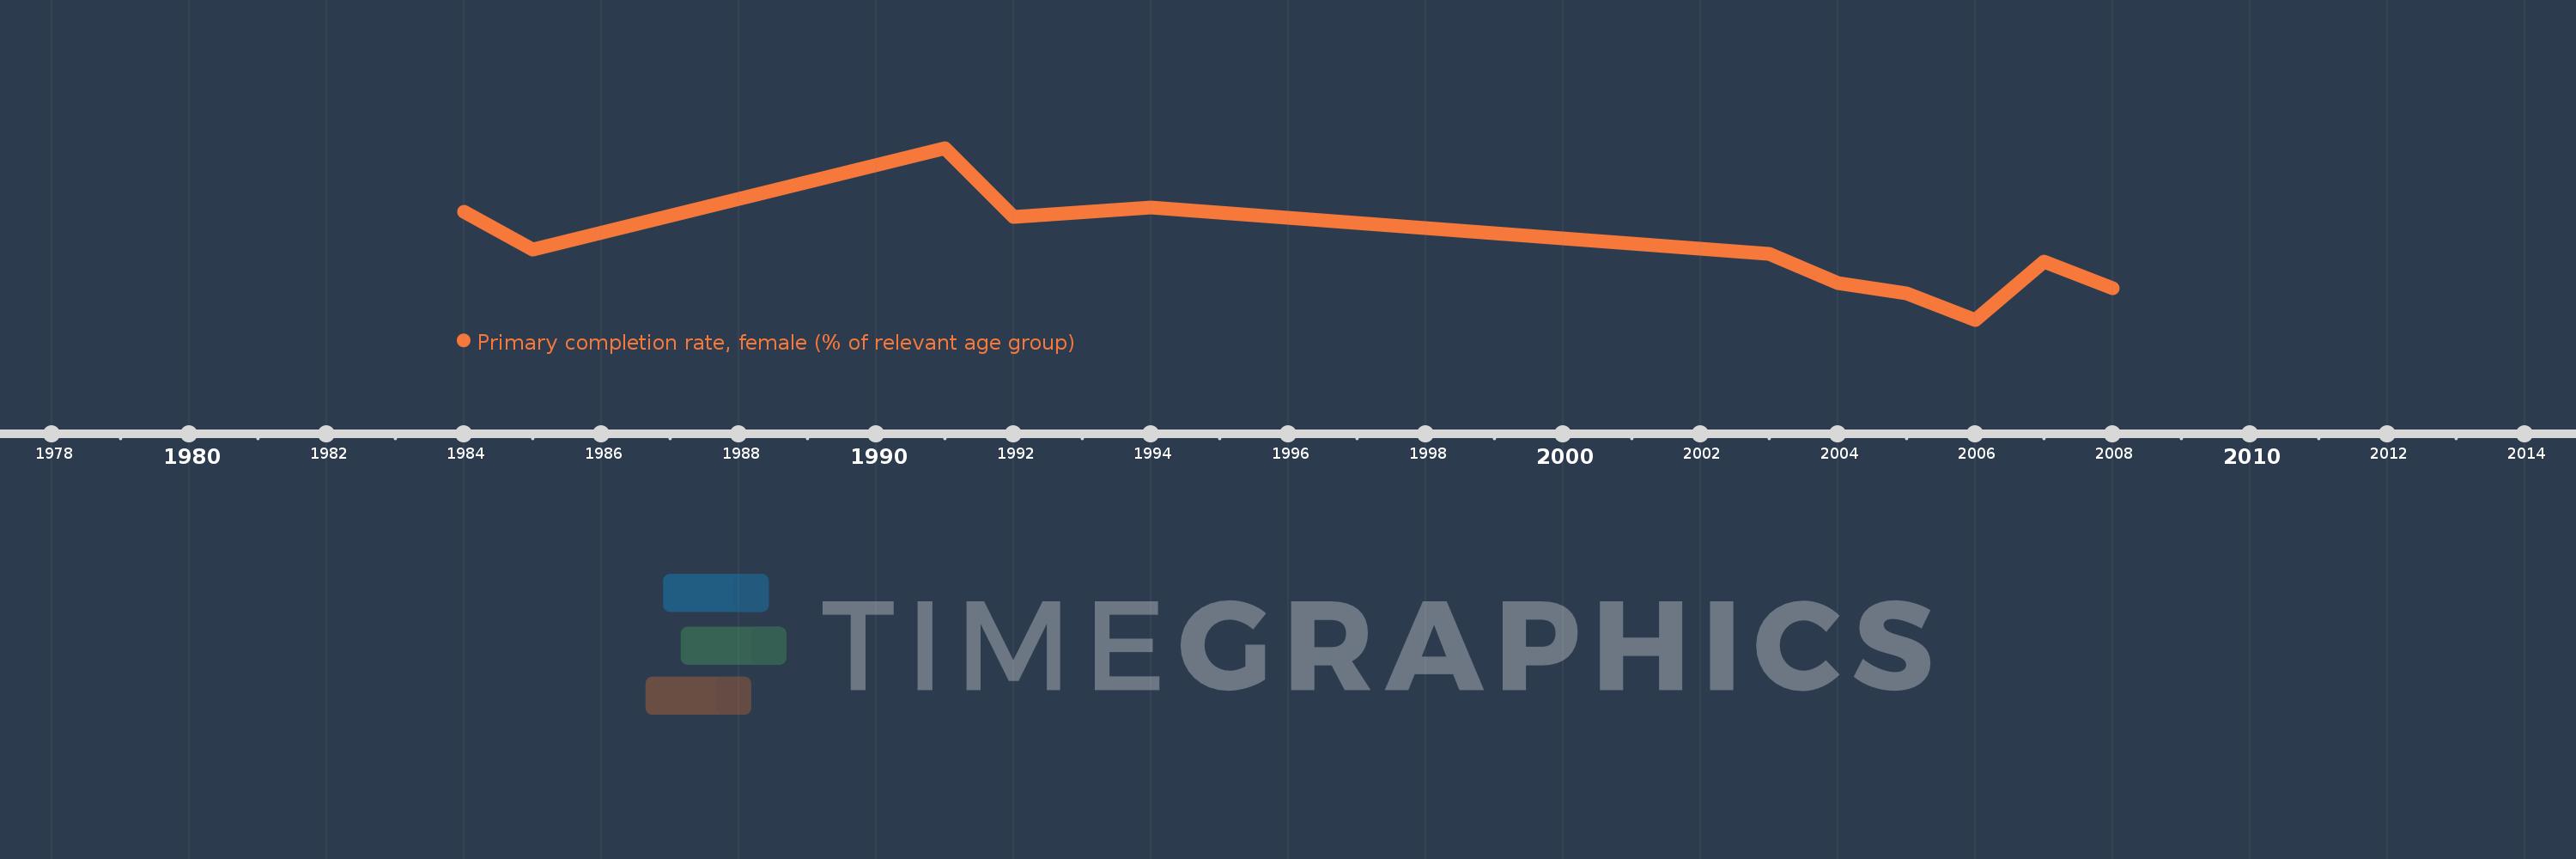
Questa scala temporale mostra un grafico dal 1984 anno al 2008 anno. St. Lucia. I dati fino ad 1983 anno non disponibili. Il numero di osservazioni attuali secondo i date: 11.
La fonte (nome):
Indicatori dello sviluppo mondiale
La fonte (organizzazione):
United Nations Educational, Scientific, and Cultural Organization (UNESCO) Institute for Statistics.
Categorie:
Education, Gender
sono stati aggiornati
23 apr 2017 anni
Indicatori delle variazioni dei valori per anni
In media:
107.336
Minima:
96.203
1 gen 2006 anni
Massimo:
123.043
1 gen 1991 anni
Alla data di osservazione
Valore
Variazione assoluta
La variazione rispetto al valore precedente
1 gen 1984 anni
113.038
+113.038
0.0%
1 gen 1985 anni
107.181
-5.857
-5.18%
1 gen 1991 anni
123.043
+15.862
14.8%
1 gen 1992 anni
112.294
-10.749
-8.74%
1 gen 1994 anni
113.676
+1.382
1.23%
1 gen 2003 anni
106.441
-7.235
-6.36%
1 gen 2004 anni
101.995
-4.445
-4.18%
1 gen 2005 anni
100.346
-1.649
-1.62%
1 gen 2006 anni
96.203
-4.143
-4.13%
1 gen 2007 anni
105.335
+9.132
9.49%
1 gen 2008 anni
101.143
-4.192
-3.98%
Classificazione dei paesi secondo i statistiche attuali per anni