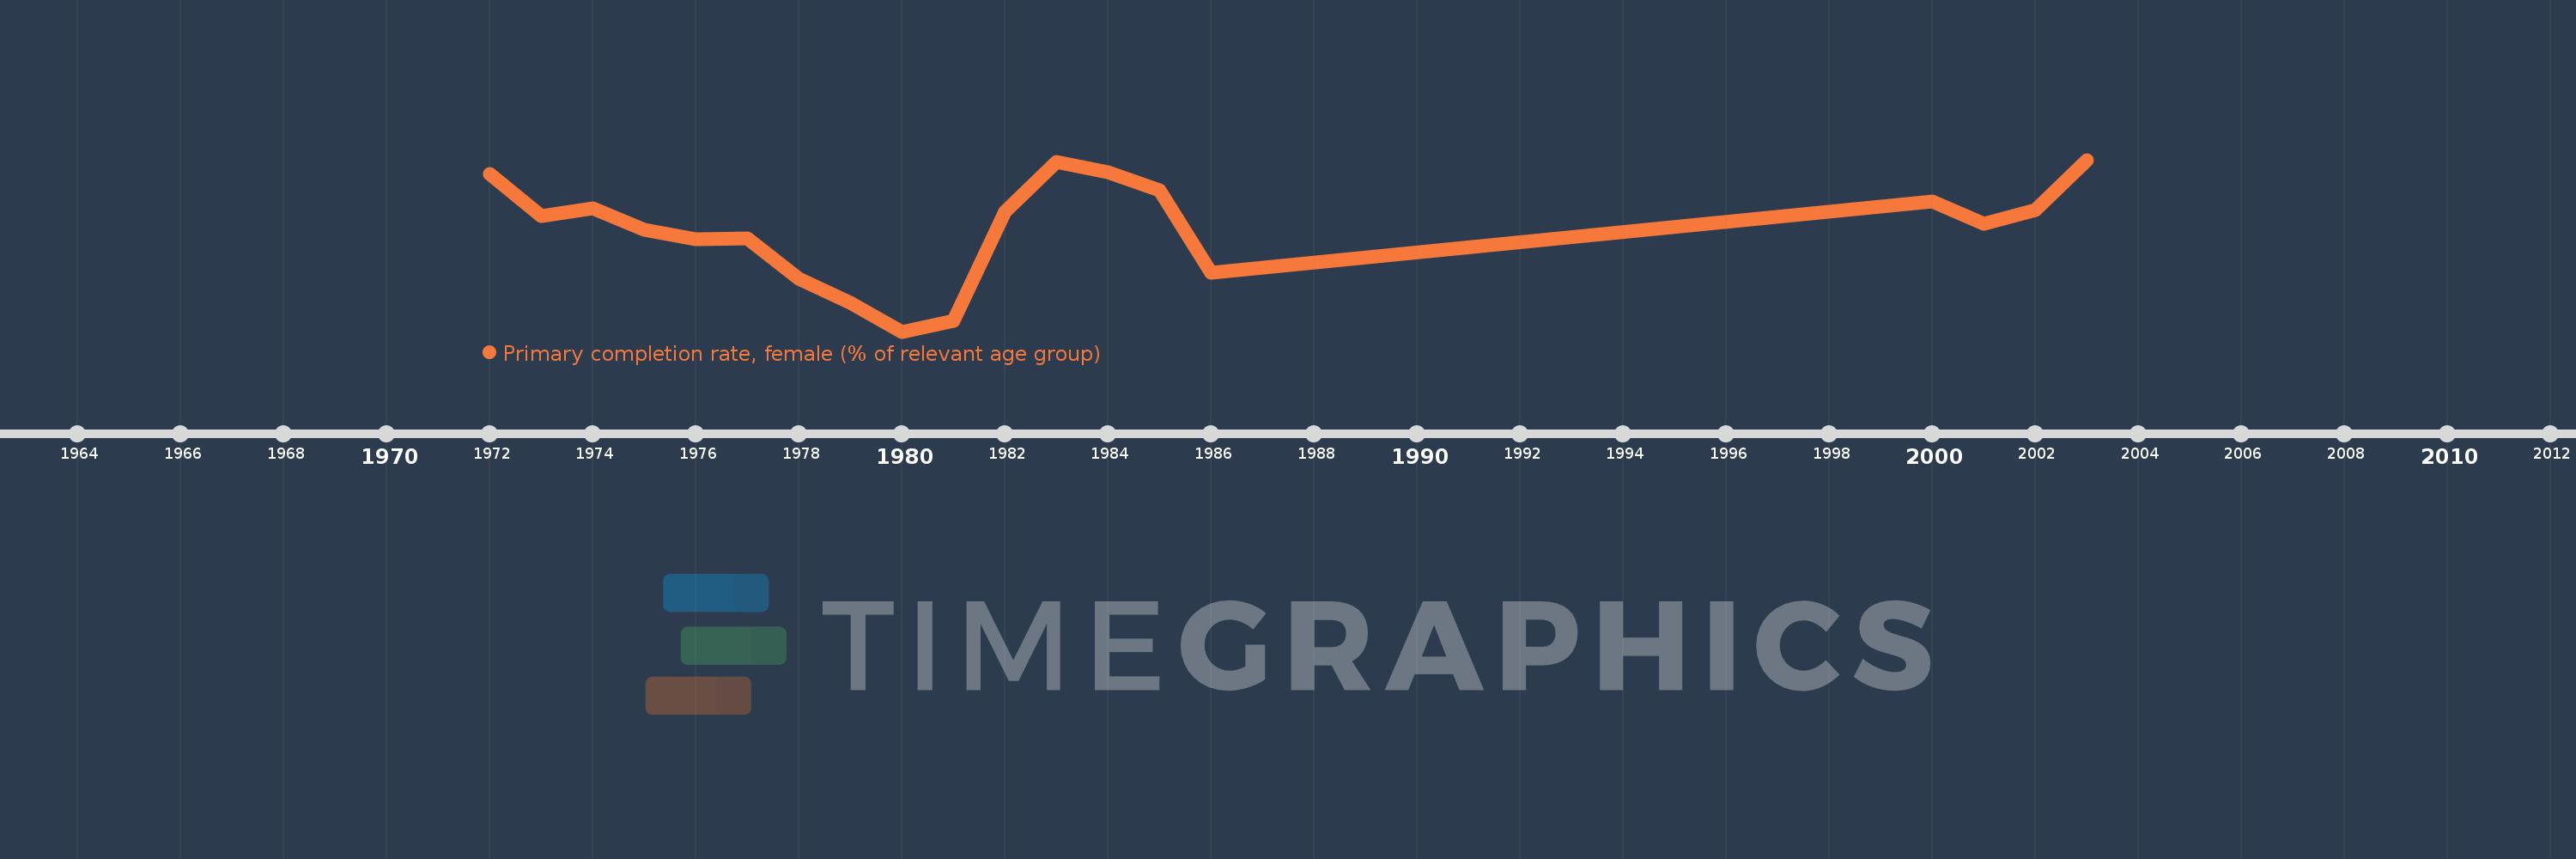
Questa scala temporale mostra un grafico dal 1972 anno al 2003 anno. Netherlands. I dati fino ad 1971 anno non disponibili. Il numero di osservazioni attuali secondo i date: 19.
La fonte (nome):
Indicatori dello sviluppo mondiale
La fonte (organizzazione):
United Nations Educational, Scientific, and Cultural Organization (UNESCO) Institute for Statistics.
Categorie:
Education, Gender
sono stati aggiornati
23 apr 2017 anni
Indicatori delle variazioni dei valori per anni
In media:
96.96
Minima:
91.957
1 gen 1980 anni
Massimo:
100.306
1 gen 2003 anni
Alla data di osservazione
Valore
Variazione assoluta
La variazione rispetto al valore precedente
1 gen 1972 anni
99.624
+99.624
0.0%
1 gen 1973 anni
97.553
-2.07
-2.08%
1 gen 1974 anni
97.954
+0.401
0.41%
1 gen 1975 anni
96.909
-1.045
-1.07%
1 gen 1976 anni
96.459
-0.45
-0.46%
1 gen 1977 anni
96.479
+0.02
0.02%
1 gen 1978 anni
94.534
-1.945
-2.02%
1 gen 1979 anni
93.341
-1.193
-1.26%
1 gen 1980 anni
91.957
-1.384
-1.48%
1 gen 1981 anni
92.488
+0.531
0.58%
1 gen 1982 anni
97.784
+5.296
5.73%
1 gen 1983 anni
100.187
+2.403
2.46%
1 gen 1984 anni
99.716
-0.471
-0.47%
1 gen 1985 anni
98.806
-0.91
-0.91%
1 gen 1986 anni
94.832
-3.973
-4.02%
1 gen 2000 anni
98.266
+3.434
3.62%
1 gen 2001 anni
97.206
-1.06
-1.08%
1 gen 2002 anni
97.849
+0.643
0.66%
1 gen 2003 anni
100.306
+2.457
2.51%
Classificazione dei paesi secondo i statistiche attuali per anni