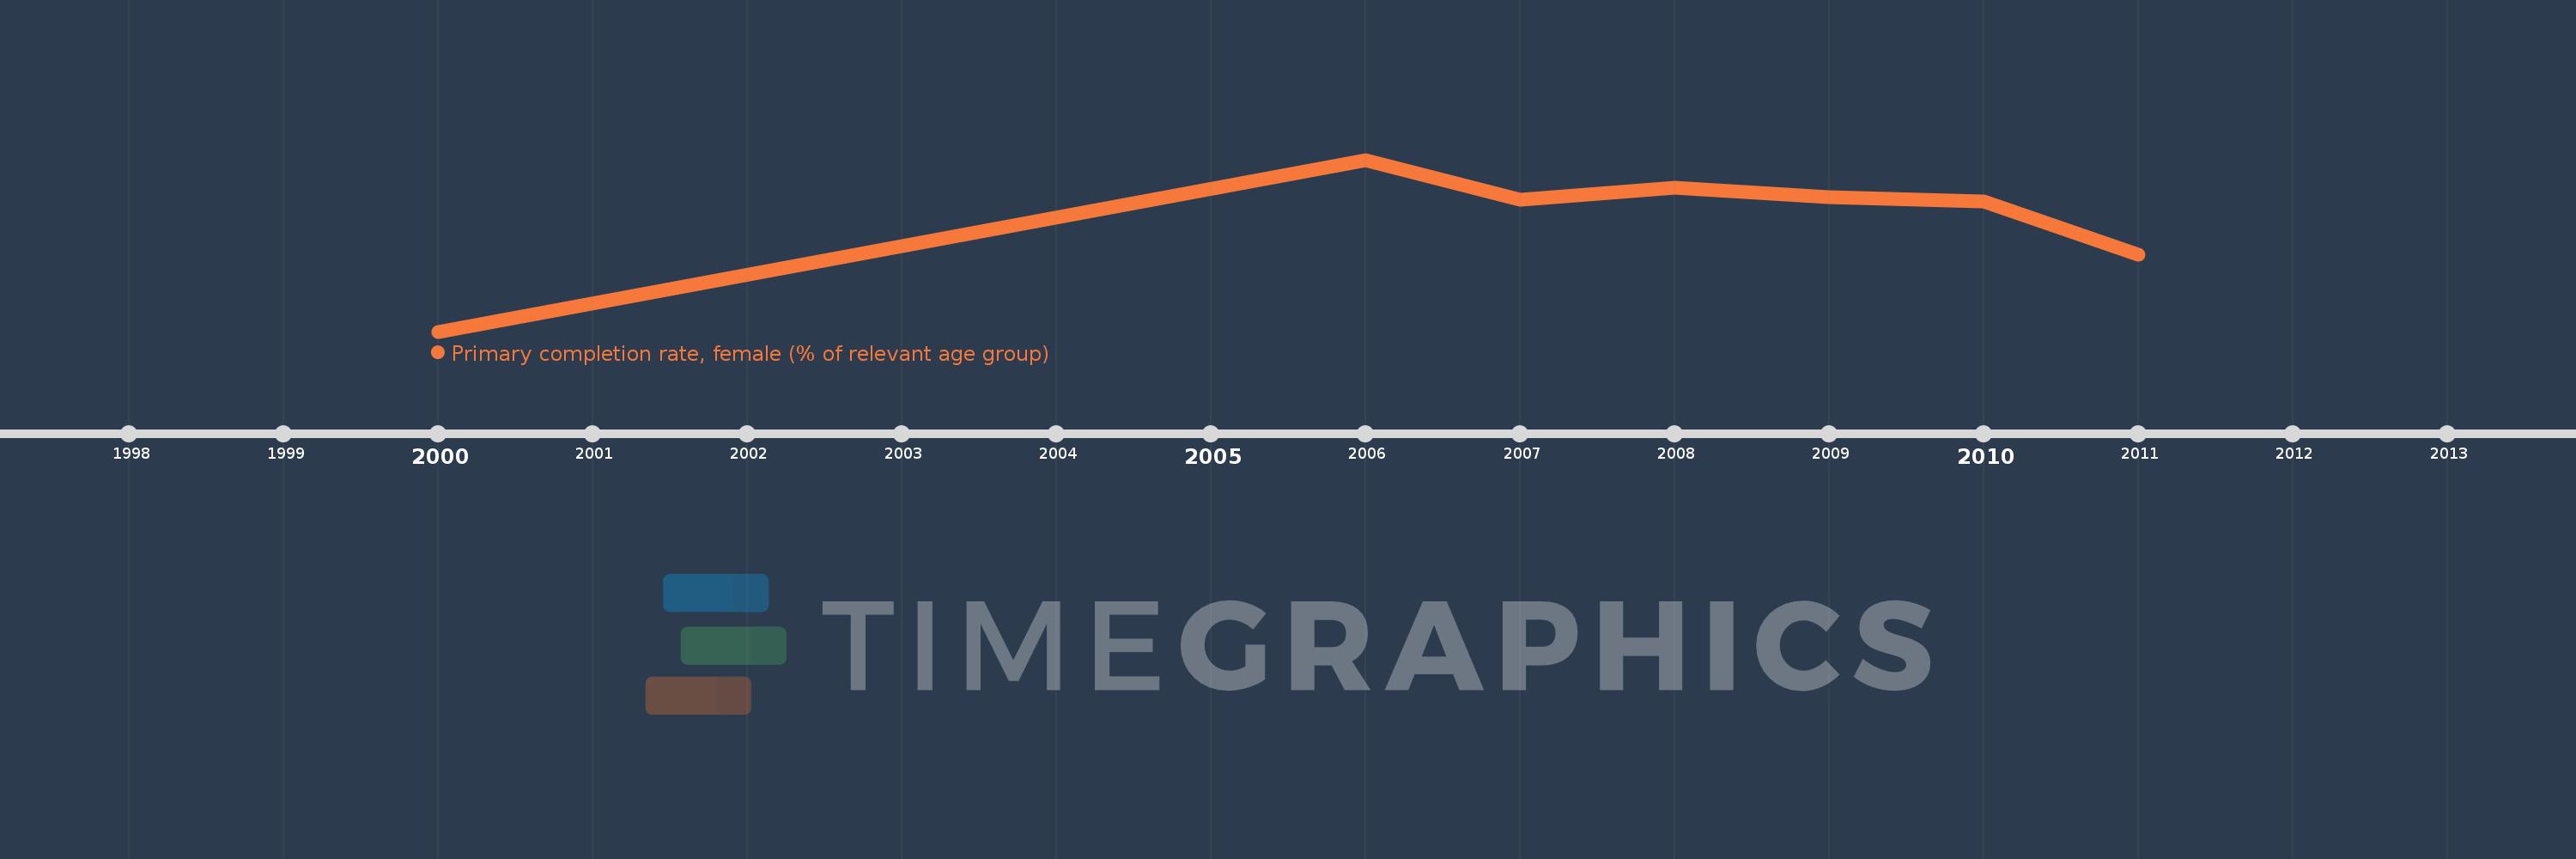
Questa scala temporale mostra un grafico dal 2000 anno al 2011 anno. Bahamas, The. I dati fino ad 1999 anno non disponibili. Il numero di osservazioni attuali secondo i date: 7.
La fonte (nome):
Indicatori dello sviluppo mondiale
La fonte (organizzazione):
United Nations Educational, Scientific, and Cultural Organization (UNESCO) Institute for Statistics.
Categorie:
Education, Gender
sono stati aggiornati
23 apr 2017 anni
Indicatori delle variazioni dei valori per anni
In media:
99.543
Minima:
84.337
1 gen 2000 anni
Massimo:
107.528
1 gen 2006 anni
Alla data di osservazione
Valore
Variazione assoluta
La variazione rispetto al valore precedente
1 gen 2000 anni
84.337
+84.337
0.0%
1 gen 2006 anni
107.528
+23.191
27.5%
1 gen 2007 anni
102.125
-5.403
-5.02%
1 gen 2008 anni
103.723
+1.599
1.57%
1 gen 2009 anni
102.481
-1.242
-1.2%
1 gen 2010 anni
101.858
-0.623
-0.61%
1 gen 2011 anni
94.752
-7.106
-6.98%
Classificazione dei paesi secondo i statistiche attuali per anni