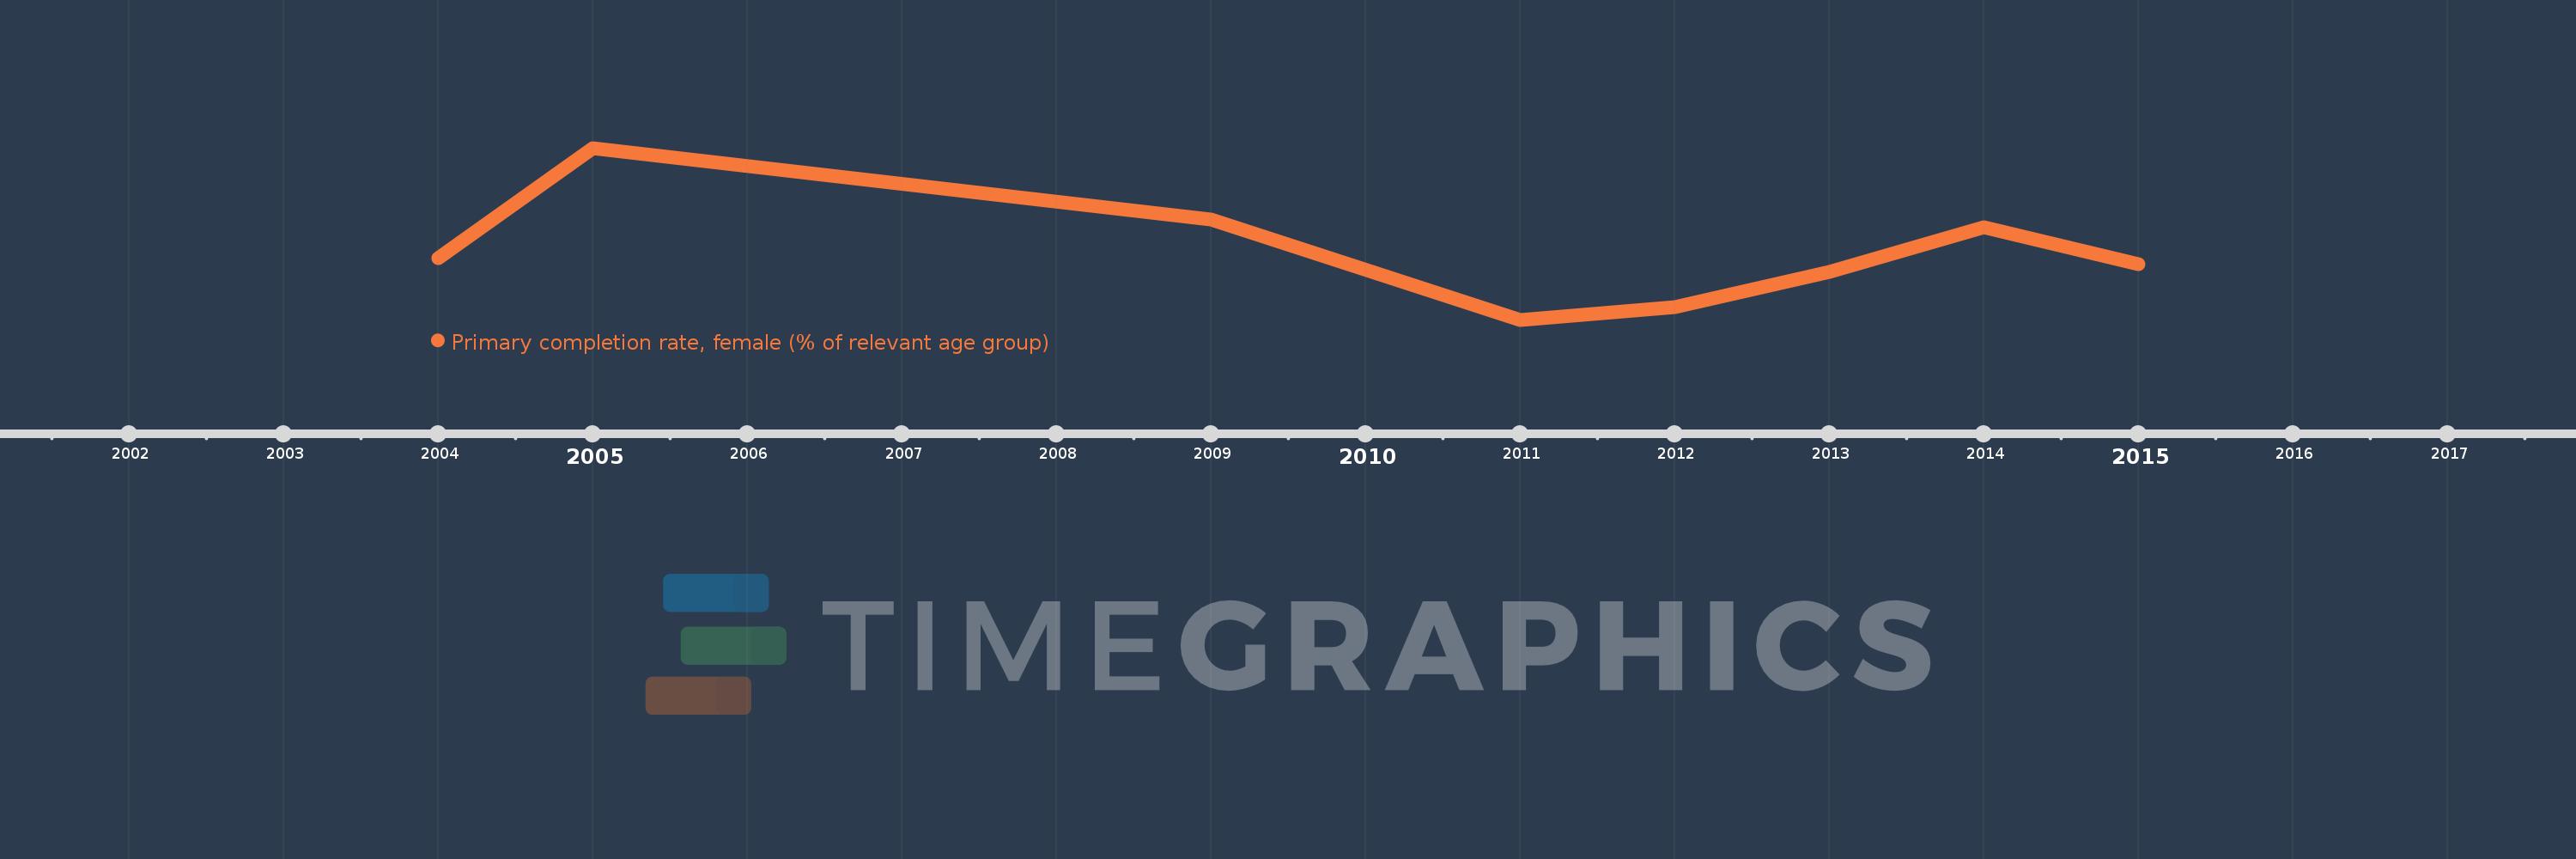
Questa scala temporale mostra un grafico dal 2004 anno al 2015 anno. St. Vincent and the Grenadines. I dati fino ad 2003 anno non disponibili. Il numero di osservazioni attuali secondo i date: 8.
La fonte (nome):
Indicatori dello sviluppo mondiale
La fonte (organizzazione):
United Nations Educational, Scientific, and Cultural Organization (UNESCO) Institute for Statistics.
Categorie:
Education, Gender
sono stati aggiornati
23 apr 2017 anni
Indicatori delle variazioni dei valori per anni
In media:
100.453
Minima:
91.586
1 gen 2011 anni
Massimo:
114.027
1 gen 2005 anni
Alla data di osservazione
Valore
Variazione assoluta
La variazione rispetto al valore precedente
1 gen 2004 anni
99.642
+99.642
0.0%
1 gen 2005 anni
114.027
+14.386
14.44%
1 gen 2009 anni
104.73
-9.297
-8.15%
1 gen 2011 anni
91.586
-13.144
-12.55%
1 gen 2012 anni
93.287
+1.701
1.86%
1 gen 2013 anni
97.853
+4.565
4.89%
1 gen 2014 anni
103.684
+5.831
5.96%
1 gen 2015 anni
98.812
-4.872
-4.7%
Classificazione dei paesi secondo i statistiche attuali per anni